In a previous blog post, I described two significant changes in the characteristics of newly arriving immigrants (legal and unauthorized) to the U.S. between 1997 and 2017. First, the share of recent immigrants aged 25 and older who had bachelor’s or advanced degrees rose from 30 percent to 48 percent. Second, the origins of new immigrants to the U.S. shifted dramatically, as immigration from Mexico and Europe declined in importance while immigration from Asia and Africa grew. In this post, I examine the relationship between these two changes.
Changes in the origins of immigrants affect the college-educated share because the likelihood that a recent immigrant has a college degree depends on their country of origin. An increase in immigration from countries with high rates of college completion tends to raise the average education level of new U.S. immigrants, while an increase in immigration from less-educated countries tends to lower it.
To identify the impact of the changing origins of new U.S. immigrants on their level of education, I apply a “shift-share” decomposition to the rise in the college-educated share since 1997. This approach poses the question, “What would have happened to the college-educated share of new immigrants if the origins of new immigrants remained constant over time?” The difference between this counterfactual scenario and what actually occurred is a measure of the impact of changes in country of origin (the “share” component). The counterfactual itself shows the impact of changes in the likelihood that a new immigrant has a college degree regardless of where they come from (the “shift” component).1
Figure 1 presents the results of this analysis. The dark line shows the total change in the college-educated share of recent immigrants aged 25 and older since 1997. This total change is decomposed into its two main components: (a) the “share” component indicating the amount of the total change that is due to shifts in the origins of immigrants (the red portion of the bars), and (b) the “shift” component indicating the amount of the total change due to general changes in educational attainment (the blue portion of the bars). The figure makes it clear that changes in the origins of U.S. immigrants are not the principal cause of the rise in the college-educated share since 1997; increased educational attainment played a far larger role. However, it also suggests two distinct eras in the evolution of the college-educated share:
From the late 1990s to 2007, the share of new immigrants with a college degree was relatively stable. Changes in the origins of new immigrants had an increasingly negative effect on the share during this period, which offset the effects immigrants’ rising educational attainment.
Since 2007, the college-educated share has increased steadily. This rise reflects both rapid gains in educational attainment and a sharp reversal in the effects of immigrants’ origins.
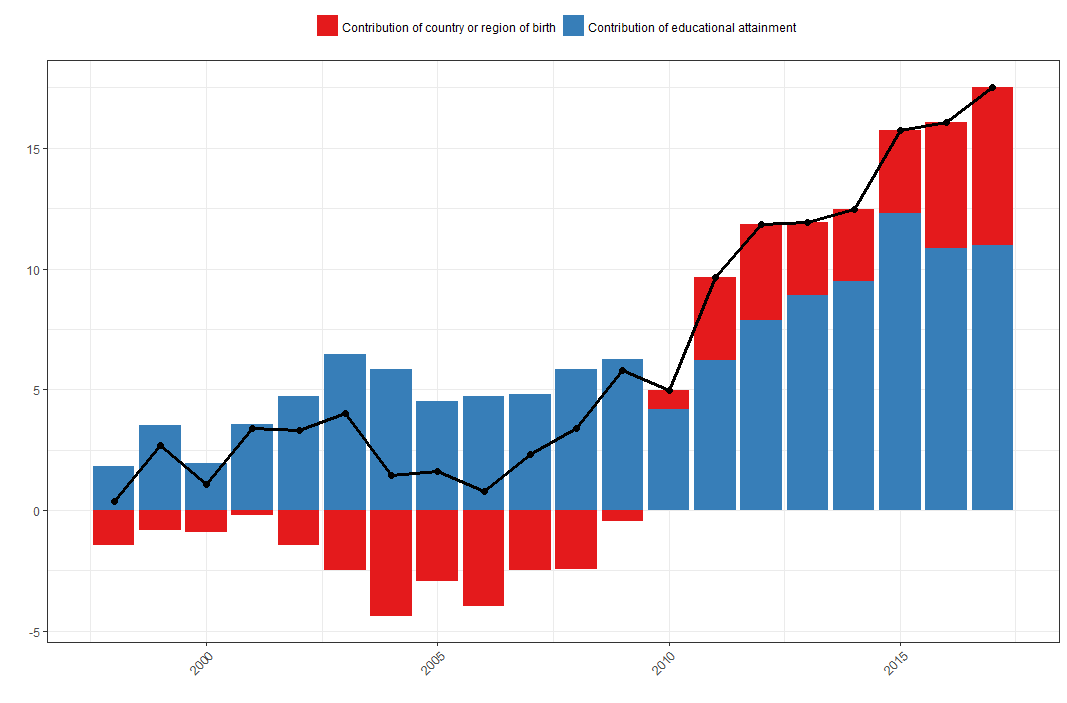
Source: PWBM calculations based on Current Population Survey Annual Social and Economic Supplement, 1997-2017.
What changed in 2007? Figure 2 provides part of the answer. It shows that the country-composition of U.S. immigration shifted suddenly around 2007. Although these estimates are sometimes noisy, several trends are clear:
Immigration from Mexico grew rapidly in the decade before 2007. Since 2007, its share has declined sharply. Once nearly a third of all new immigrants, Mexicans now accounts for about one eighth.
Immigration from Europe fell steadily before 2007. Since 2007, it’s share has stabilized around 10 percent.
Immigration from Africa was relatively stable around 4 percent of new immigrants in the years before 2007. Since 2007, it has grown rapidly to nearly 10 percent.
Immigration from India had grown consistently since 1997. Since 2007, and especially in recent years, that growth has accelerated. India now accounts for a larger share of new immigrants than any other country.
While these are some of the starkest and most consequential shifts occurring around 2007, they are not the only ones. The supplemental tables that accompany this brief provides a fuller country-by-country decomposition of changes in the overall share from 1997 to 2007 and from 2007 to 2017. These tables show the contributions of changes in origins and changes in educational attainment for individual countries and regions.
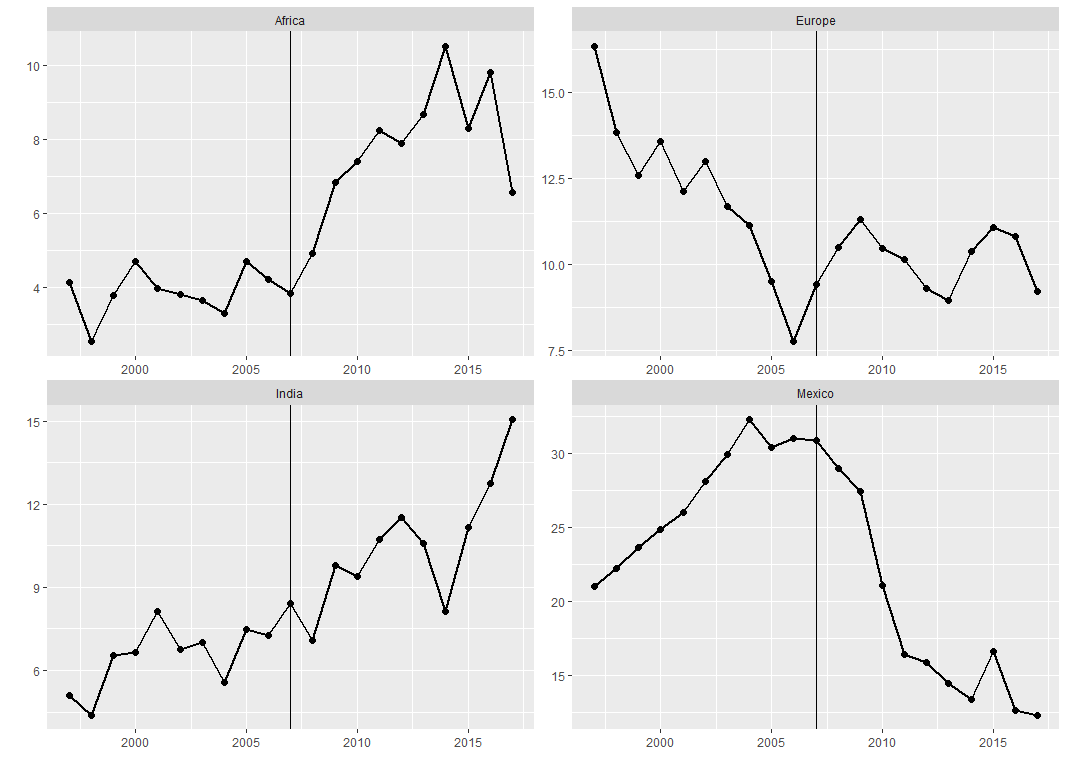
Source: PWBM calculations based on Current Population Survey Annual Social and Economic Supplement, 1997-2017.
These large, sudden shifts in the origins of new immigrants had a significant impact on the overall college-educated share in recent years. While educational attainment continued rising after 2007, changes in origins account for 60 percent of the increase in the overall share since then. In 2016 and 2017, the change in immigrant origins were the sole driver of continued increases in the share, offsetting a small decline in average educational attainment. Thus, 2007 appears to mark a turning point in the evolution of the college-educated share.
-
The counterfactual is based on a chain-weighted calculation in which country or region shares are held constant only from one year to the next. This eliminates any sensitivity to a choice of base year. ↩
,Contribution of country or region of birth,Contribution of educational attainment,Total
1998,-1.45,1.81,0.36
1999,-0.81,3.51,2.70
2000,-0.91,1.96,1.06
2001,-0.19,3.58,3.39
2002,-1.44,4.74,3.30
2003,-2.47,6.47,4.00
2004,-4.39,5.83,1.44
2005,-2.93,4.53,1.61
2006,-3.97,4.73,0.77
2007,-2.48,4.82,2.34
2008,-2.46,5.84,3.38
2009,-0.46,6.25,5.79
2010,0.76,4.20,4.96
2011,3.44,6.22,9.66
2012,3.95,7.87,11.83
2013,3.04,8.90,11.93
2014,2.99,9.50,12.49
2015,3.43,12.29,15.73
2016,5.25,10.84,16.09
2017,6.54,10.99,17.54
,Africa,Europe,India,Mexico
1997,4.12,16.34,5.10,21.00
1998,2.53,13.83,4.40,22.24
1999,3.77,12.60,6.55,23.63
2000,4.71,13.58,6.64,24.87
2001,3.98,12.12,8.12,26.02
2002,3.82,13.01,6.75,28.09
2003,3.65,11.68,7.01,29.96
2004,3.30,11.12,5.57,32.26
2005,4.71,9.51,7.48,30.41
2006,4.23,7.74,7.28,31.01
2007,3.83,9.40,8.42,30.89
2008,4.92,10.49,7.09,29.01
2009,6.83,11.32,9.80,27.44
2010,7.41,10.45,9.39,21.10
2011,8.23,10.13,10.72,16.45
2012,7.88,9.31,11.52,15.86
2013,8.68,8.95,10.59,14.49
2014,10.50,10.37,8.13,13.37
2015,8.28,11.08,11.17,16.65
2016,9.81,10.81,12.76,12.67
2017,6.58,9.21,15.04,12.34