
Key Points
- The Penn Wharton Budget Model’s Social Security Policy Simulator allows users to see the results of six policy options and combinations of those options, for a total of 4,096 policy combinations. Most policies can be simulated on a standard static basis or on a dynamic basis that includes macroeconomic feedback effects.
- Relative to estimates by the Social Security Administration, the Penn Wharton Budget Model shows a faster and larger deterioration of the program’s finances. Our results are a bit closer to the Congressional Budget Office’s projections.
- Many standard policy options for achieving solvency barely move the date that the Social Security Trust Fund runs out of money, but they might contribute significantly to the long-run shortfall. Either combinations of several policy changes or larger changes are required for securing Social Security.
The Penn Wharton Budget Model’s Social Security Policy Simulator
MATERIAL IN THIS BRIEF IS NOW OUTDATED. AN UPDATED SIMULATOR IS AVAILABLE HERE.
Introduction
The Penn Wharton Budget Model (PWBM) allows policymakers, members of the media, and the general public (“users”) to see the impact that potential reforms to Social Security will have on the Trust Fund, payroll tax revenues, benefits, and other key metrics. Potential reforms include an increase in Social Security’s payroll tax rate, an increase in the taxable maximum earnings limit, an option to base annual Social Security’s annual Cost-of-Living Adjustment (COLA) on a chain-weighted version of the Consumer Price Index for Urban Wage Earners and Clerical Workers (CPI-W), an across-the-board reduction or across-the board increase to Social Security benefits, a progressive benefit reduction, and an increase in the normal retirement age. Any combination of these policy options can be considered at the same time, thereby allowing for a total of 4,096 policy combinations. The PWBM’s model can be ran on a static basis or with dynamics that account for how individuals respond to policy changes. Our analysis below focuses on our benchmark model.
Solvency of the Trust Fund
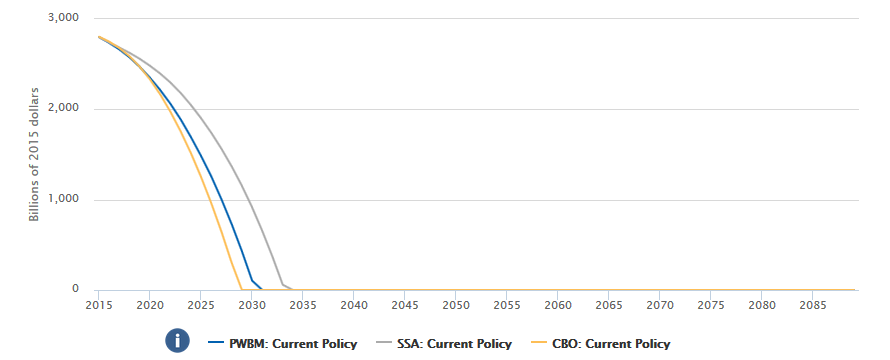
As shown by the blue-colored “PWBM: Current Policy” line in Figure 1, the Penn Wharton Budget Model predicts that the combined Old-Age and Survivors Insurance and Disability Insurance Trust Fund (Social Security Trust Fund) will exhaust in just 14 years, in 2031. PWBM’s estimate is three years earlier than the run-out date of 2034 that was estimated in the 2015 Social Security Trustees Report, as indicated by the gray line in Figure 1. Moreover, our projections show that the shortfall in 2031 will equal about $350 billion in 2015 dollars. The annual shortfall is expected to increase to $1.3 trillion, also in 2015 dollars, within 75 years. Under current law, barring any additional action, benefits would be reduced by about 30 percent in 2031.
According to the Social Security Administration’s (SSA) Income of the Aged Chartbook, 2014, six in 10 aged beneficiary units (married and nonmarried) received half or more of their income from Social Security benefits and more than a third of aged beneficiary units relied on Social Security benefits for 90 percent or more of their income.
Figure 1: Trust Fund Reserves - No policy change
Relative to SSA and CBO
The PWBM models households at an individual level and uses what is known as a “stochastic simulation.” Hundreds of thousands of individuals, across a wide range of population subgroups, are calibrated to Census-level data. Using a variety of additional large data sets, households are assigned key economic attributes including, fertility, mortality, immigration, labor-force participation rates, education, marriage, divorce, capital, disabilities, and earnings. Households are then subject to various life events: They grow up, go to school, get married, potentially divorce, get jobs, pay taxes, and eventually retire and receive Social Security benefits. The model is first tested using historical data before being used to make future projections of policy changes. The dynamic version of the model uses fewer representative households, to reduce computation costs, but it then allows households to change several key attributes in response to a change in policy, including their labor supply and capital holdings. These changes then impact the economy, economic growth, and the distribution of income over time.
The Social Security Administration (SSA) uses a more aggregated “cell-based” approach that deals with groups rather than single individuals. One of the reasons that the PWBM projects an earlier Social Security Trust Fund depletion date is that the individual Census-level detail of the PWBM allows it to take account of how demographic shifts affect worker productivity. For example, the retirement of the Baby Boom generation means that many experienced, high productivity workers will exit the labor force and be replaced by younger and less productive workers. The retirement of the baby boom generation will therefore reduce Social Security’s payroll tax revenues and worsen the system’s finances. Cell-based methods typically do not fully control for these compositional changes.
The PWBM estimates are a bit closer to those produced by the Congressional Budget Office (CBO). The CBO projects that the Social Security Trust Fund will run out of money at the end of 2029, while the PWBM expects the Trust Fund to be exhausted two years later in 2031. The projections differ because, although the PWBM and the CBO use similar types of models for analyzing Social Security, they make different assumptions. Like the Social Security Trustees, the PWBM assumes that life expectancy will increase at a slower rate, the incidence of disability will be a little lower, and long run interest rates will be a bit higher than does the CBO.
Choosing the Policy Options
The Penn Wharton Budget Model group is not only non-partisan, we are also non-normative. We, therefore, never advocate for or against a particular policy change. Still, the selection of policies to simulate is subjective. Policies chosen for simulation are arrived upon using an internal legislative tracking process as well as an external consultative process. External consultations include current policymakers, former policymakers as well as internal and external academics, representing a reasonably wide political spectrum.
As a result of these discussions, our policy selection tend to focus on generalized policies that are widely discussed by policy makers, researchers, the media, and the American public. For example, our Social Security simulations do not include any transitions to private accounts. Nor do our simulations include policies such as reducing the retirement age. These policy choices, though, do not indicate our view of the desired range of policies, and we will adjust the policies as the legislative landscape changes. Moreover, Congressional staff can request special analysis of specific policies that are not covered by our simulation analysis, and we will do our best to accommodate.
Policy Option: Increasing the Payroll Tax Rate
The PWBM shows the effect of increasing Social Security’s payroll tax rate in 2017. Currently, the payroll tax is 12.4% of earnings covered by Social Security. The online tool gives users the option to see the effects of increasing that tax rate to 14.4, 15.4, and 16.4 percent. If Social Security’s payroll tax is increased by two percentage points in 2017 to 14.4 percent of covered income, the Social Security Trust Fund will be depleted in 2043 rather than 2031. As shown Figure 2, increasing the payroll tax rate to 14.4 percent raises tax revenue in 2050 from $1.4 trillion in the baseline projection (the blue line in Figure 2) to $1.7 trillion (the red line in Figure 2). Increasing the payroll tax rate does not change Social Security benefits, so Social Security’s interest income, income surplus, and non-interest surplus all rise with the payroll tax rate.
Figure 2: Social Security Taxes - Policy change increase to payroll taxes to 14.4 percent

Policy Option: Increase the Taxable Maximum
Social Security is primarily funded by a payroll tax on the first $118,500 of each workers’ covered earnings. The $118,500 threshold changes over time with overall earnings growth and is known as the “taxable maximum” (TaxMax). The PWBM projects that if the TaxMax were increased to $250,000 in 2017 then Social Security’s Trust Fund would stay positive for four more years, reaching exhaustion in 2035. These calculations, however, assume that earned benefits are not recomputed when some people pay higher payroll taxes, and so these results are especially favorable toward improving Social Security’s finances. If the TaxMax were increased to $400,000, our preliminary estimate is that the Trust Fund would exhaust in 2036. (The result is preliminary because we recently added the $400,000 option, and so we are currently doing additional validation checks.)
As our model currently stands, estimates of the effects of setting the TaxMax above $400,000 might be less reliable. One difficulty is that official government data sources “top code” (mask) income levels higher than this amount, and so some imputation is required. A second challenge is the possibility that a higher TaxMax would lead some income to be reclassified from earned to unearned income (or, the creation of more S corporations) as a way to avoid paying payroll taxes. In a future release of the Social Security simulator, however, we plan to address both of these issues so that we can consider even higher TaxMax levels.
Notice that even if a particular increase in the TaxMax does not, in itself, substantially extend the Trust Fund exhaustion date, it can be a component of balancing Social Security’s long-term finances. The Social Security tool allows users to also explore a wide range of policy combinations. As Figure 3 shows, increasing the TaxMax to $250,000, increases Social Security’s annual non-interest surplus (payroll tax revenue received less benefits paid) in 2050 from negative $550 billion in the baseline projection to negative $450 billion.
Figure 3: Non-Interest Surplus - Policy change to increase TaxMax to $250,000

Policy Option: Base COLA’s on the Chained CPI-W
Under current law, Social Security benefits are adjusted for inflation by increasing benefits with an annual cost-of-living adjustment (COLA) that is based on the Consumer Price Index for Urban Wage Earners and Clerical Workers (CPI-W). The Penn Wharton Budget Model estimates the effect of changing Social Security’s annual COLA benefit increases from the current CPI-W to a chained-weighted version of the CPI-W. Chained CPI-W accounts for consumers who, when faced with rising prices, alter their purchases to buy less expensive goods.
Moving to the chained CPI-W starting in 2017 is projected to extend the exhaustion date of the Social Security Trust Fund by one year, to 2032 rather than 2031. Figure 4 shows that the interest income Social Security receives will rise slightly as a result of a switch to the chained CPI-W in 2017. Basing Social Security’s COLAs on the chained CPI-W would not materially change Social Security’s tax revenue but would slightly reduce benefits. Implementing a COLA change after 2017 would have a more modest effect.
Figure 4: Interest Income - Policy change COLA to chained CPI-W in 2017

Policy Option: Across-the-Board Benefit Increase or Decrease
The online simulator includes options to reduce benefits for all current and new retirees by 15 and 25 percent starting in 2017, as well as an option to increase benefits by 15 percent for all recipients. If Social Security policy remains unchanged, the PWBM model projects that benefits will have to be reduced by about 30 percent for all recipients starting in 2031, when the Trust Fund is exhausted. Figure 5 shows the long term impact of a 15 percent across-the-board benefit reduction on Social Security benefits and other expenditures. An across-the-board benefit reduction of 15 percent is found to prolong the Social Security Trust Fund by 18 years, to 2049. An across-the-board benefit reduction of 25 percent in 2017 would keep the trust fund positive through 2089, the analysis window. Increasing Social Security benefits by 15 percent would cause the Trust Fund to exhaust several years earlier, in 2025.
Figure 5: Benefit and Other Expenditures - Policy change an across-the-board benefit reduction of 15 percent in 2017

Policy Option: Progressive Benefit Reduction
The Penn Wharton Budget Model also estimates the effects changing Social Security’s benefit formula to make it more progressive, resulting in a benefit reduction that would only affect those with higher lifetime incomes. Benefits would remain stable for those with lower lifetime incomes.
As is shown in Figure 6, reducing benefits for workers with higher lifetime incomes does not move the Social Security Trust Fund exhaustion date from 2031. Likewise, the PWBM finds that a progressive benefit reduction has little effect on Social Security tax revenues and interest income. However, it substantially improves the non-interest surplus by 2050, from negative $550 billion to negative $368 billion, and so could contribute to a reduction in the longer-term shortfalls.
Figure 6: Trust Fund Reserves - Policy change a progressive benefit reduction of 0.50 percentage points per year

Policy Option: Increasing the Normal Retirement Age (NRA)
The Normal Retirement Age (NRA) is the age at which workers can claim Social Security retirement benefits that are not adjusted for retiring early nor for retiring later. Social Security’s NRA is already increasing from age 65 to age 67 under current law. The Penn Wharton Budget Model can simulate increasing the NRA beyond age 67, in two-month increments per year of birth, similar to the rate at which Social Security’s NRA is currently increasing. Regardless of the age that the NRA is set, the model projects that the Trust Fund is expected to exhaust in 2031 because changes to the NRA phase-in slowly and only affect future retirees. Increasing the NRA lowers Social Security benefits, but total benefits continue to grow as the Baby Boom generation retires and life expectancy continues to increase. However, Figure 7 shows that an increase in the NRA to age 70 does significantly improve Social Security’s income surplus (total revenue received less benefits paid) in the long run. Non-interest income surplus is also improved in the long run.
Figure 7: Income Surplus - Policy change to increase the normal retirement age to age 70

Conclusion
The Penn Wharton Budget Model allows the user to simulate the impact of six different Social Security policy reform options, at four different settings within each option. With a total of 4,096 combinations to choose from, users of the model are encouraged to experiment with their own settings.