As noted in our brief, the Tax Cuts and Jobs Act reduced the direct tax liability of individuals by an estimated $1.3 billion, before considering macroeconomic feedback effects, over the period 2018-27.1 This reduction was achieved through a number of provisions that changed the individual income tax structure. Table 1 presents the average tax cut received by Adjusted Gross Income (AGI) percentile in 2018.2 The overall median tax cut is $401, with larger cuts going to groups with larger AGI.3
| Adjusted Gross Income (percentile) | Average Tax Change in 2018 From Previous Law | Average Total Expenditures in 2018 | Average Gas Expenditures in 2017 | Average Gas Expenditures as a Share of Income in 2017 | Average Gas Expenditures at Peak Prices on May 14, 2018 | Average Gas Expenditures at Peak Prices on May 14, 2018 with 1.25% Lower Consumption of Gas |
|---|---|---|---|---|---|---|
| 0-10 | -$13 | $21,152 | $494 | 10.79% | $576 | $568 |
| 10-20 | -$99 | $24,731 | $652 | 4.78% | $761 | $751 |
| 20-30 | -$163 | $29,514 | $845 | 3.85% | $986 | $974 |
| 30-40 | -$277 | $34,023 | $1,098 | 3.55% | $1,281 | $1,265 |
| 40-50 | -$401 | $40,480 | $1,190 | 2.88% | $1,388 | $1,371 |
| 50-60 | -$537 | $46,807 | $1,412 | 2.63% | $1,647 | $1,627 |
| 60-70 | -$727 | $54,093 | $1,760 | 2.47% | $2,053 | $2,028 |
| 70-80 | -$1,067 | $61,622 | $1,779 | 1.88% | $2,076 | $2,050 |
| 80-90 | -$1,203 | $74,965 | $2,117 | 1.61% | $2,469 | $2,438 |
| 90-100 | -$3,482 | $112,348 | $2,356 | 1.02% | $2,749 | $2,714 |
One way to put the size of the tax cuts in context is to consider expenditures across the income distribution. The third column of Table 1 contains the average projected expenditures for each income group.4 As expected, expenditures increase as AGI increases. However, the average tax cut represents a generally increasing share of total expenditures. The increase in expenditures is an important metric to consider in evaluating the overall benefit of the tax cuts. Over the last few months with lower withholding rates, most taxpayers have seen their disposable income rise. However, as Figure 1 shows, gasoline prices have steadily increased over the same period. The U.S. average retail gasoline price has risen nearly 20 percent since this time last year and is at its highest price since November of 2014.5 Columns 4-6 of Table 1 contain the projected gasoline expenditures under three scenarios. The first is the gas expenditures at the 2017 yearly average price; the second is the gas expenditure level with 2017 quantity demanded but faced with the current higher retail price; the third is the gas expenditure level with the current higher retail price but with reduced consumption as suggested by the estimated elasticity in Coyle et al (2012).6 Under the higher 2018 price, the bottom half of the AGI distribution “loses” at least 49% of their tax cut to the higher price -- that is, their higher disposable income due to the tax cut will be somewhat offset by having to spend more on gasoline. If consumers adjust their gasoline consumption, this group still stands to “lose” 45 percent of the tax cut due to higher gas prices.
Figure 1: Weekly U.S. Retail Gasoline Price - All Grades, All Formulations
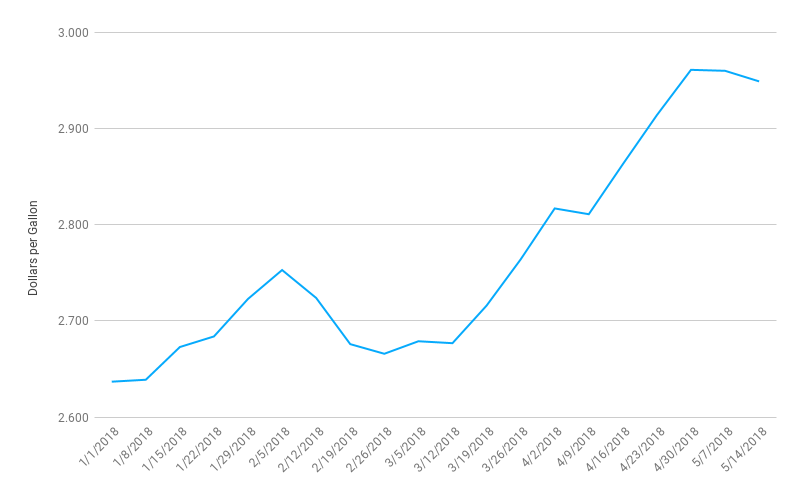
Source: Source: U.S. Energy Information Administration
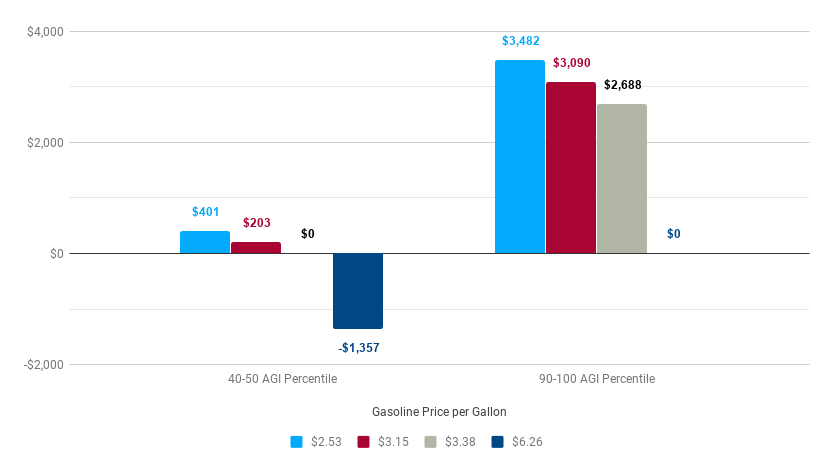
If gasoline prices continue to increase, it is possible that more than just the lowest two percentile groups would “lose” all of their individual income tax cut to the higher price. Figure 2 shows that if gasoline prices were to increase to $3.38 per gallon, the 40-50th AGI percentile would lose the average disposable income gain with lower percentiles losing even more than their gains from the tax cut. If gasoline prices were to increase to $6.26 per gallon, the entire distribution would “lose” at least the average disposable income gain from the tax cut.
Figure 2: Tax Change Net of Gas Expenditure Change in 2018 for Households in the 40-50 and 90-100 AGI Percentile by Selected Gasoline Prices
[This post has been amended to include average gas expenditures as a share of income in Table 1.]
-
This analysis does not account for changes in labor or savings as a result of the TCJA. ↩
-
This measure includes only the individual income tax changes resulting from TCJA. ↩
-
While this presentation is informative and useful in the current analysis, it is not the only way to present the tax cuts. Our brief on the Senate version of the tax bill provides a primer on distributional analysis. A full distributional analysis of the tax changes is forthcoming. ↩
-
Projected average expenditures is a result of the consumption module of PWBM’s overall model. In the near future, we will be releasing the consumption model details. ↩
-
Retail gasoline prices are taken from the U.S. Energy Information Administration. “Weekly U.S. All Grades Reformulated Retail Gasoline Prices (Dollars per Gallon).” https://www.eia.gov/dnav/pet/hist/LeafHandler.ashx?n=PET&s=EMM_EPM0R_PTE_NUS_DPG&f=W. ↩
-
Coyle, David, Jason DeBacker, and Richard Prisinzano. “Estimating the Supply and Demand of Gasoline Using Tax Data.” Energy Economics 34, no. 1 (January 1, 2012): 195–200. ↩
Week of,Weekly U.S. All Grades All Formulations Retail Gasoline Prices Dollars per Gallon
1/1/2018,2.637
1/8/2018,2.639
1/15/2018,2.673
1/22/2018,2.684
1/29/2018,2.723
2/5/2018,2.753
2/12/2018,2.724
2/19/2018,2.676
2/26/2018,2.666
3/5/2018,2.679
3/12/2018,2.677
3/19/2018,2.716
3/26/2018,2.764
4/2/2018,2.817
4/9/2018,2.811
4/16/2018,2.863
4/23/2018,2.914
4/30/2018,2.961
5/7/2018,2.960
5/14/2018,2.949
Percentile Group,$2.53,$3.15,$3.38,$6.26
40-50 AGI Percentile,401,203,0,-1357
90-100 AGI Percentile,3482,3090,2688,0