

Introducing PWBM’s DataView
Introducing PWBM’s DataView
Have you ever wondered how employment has changed over time? How stock market returns vary with different economic factors? Or, why average wages differ so much across US states?
Find answers to your economics questions with PWBM’s DataView.
DataView is a powerful new tool that simplifies collecting, visualizing, and analyzing government and other public data:
-
Search across millions of data series available from dozens of sources.
-
Transform and combine data as desired using simple “point and click”.
-
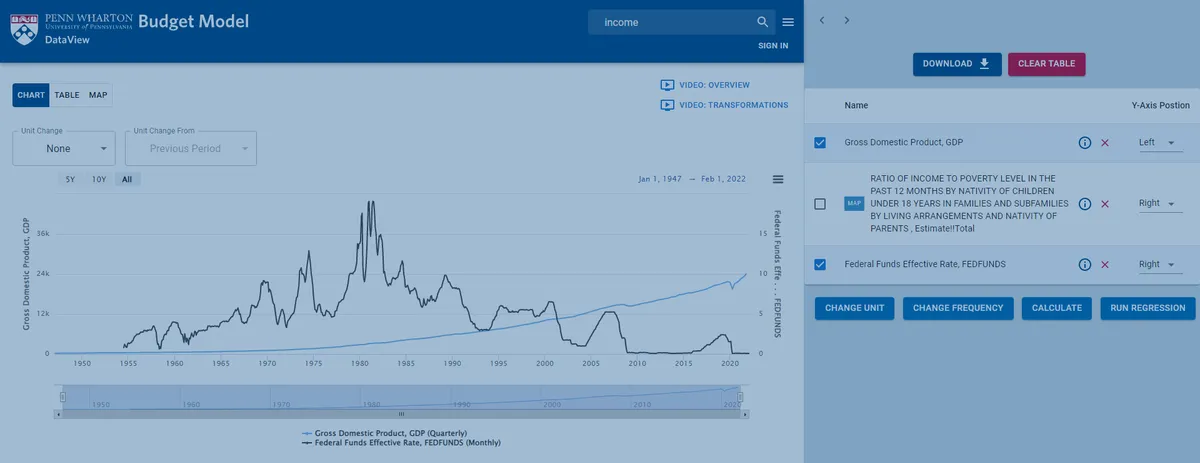
Visualize your data with graphs, tables, scatterplots, and animated US maps.
-
Test your ideas using integrated regression analysis.
-
Create an account to save your work for later as well as share with others.
DataView provides content from a variety of government and academic sources with a focus on public policy and macroeconomics. Government revenue and spending, jobs data, economic indicators, population surveys and demographic data are just a few. Stock market data is also available simply by typing the name of the firm --- no ticker symbols required.
Anyone interested in policy or economics will find value in PWBM’s DataView.
As a teacher, open our web interface within a standard browser live in the classroom. Show simple trends or animated US data maps. Combine data from multiple sources to create a time-series regression model at the national level or a state-level fixed-effects model to show the statistic relationship across many variables at the national or state level. View statistical significance of each relationship. For more advanced analysis, even construct a multi-stage regression to test for causation using instrumental variables. Give a class assignment that students solve right in the DataView; each student just sends a unique code (much like sharing a Dropbox™ file) with their submission that allows the instructor to see each student’s work.
For members of the media, cut and paste visuals directly from our web interface into your work as a PNG file. Or, download the data for use in your own charting tools.
Academics can download data from numerous sources into a consistent format for immediate use in research. Congressional staffers can retrieve data across numerous sources for backgrounders with Members.
Currently, DataView includes US national- and state-level data. Future releases will expand our offering to international data and county-level US data. Additionally, our platform is designed so that new sources are “plug and play.” Any digital data is a potential source for DataView, from websites, to spreadsheets, to proprietary data files. Content owners will be able to join our platform and upload their own data. As a result, we expect DataView to grow rapidly in the weeks and months ahead.