The IRS estimates the tax gap from the individual income tax (the amount of true income tax liability that goes unpaid) was $245 billion annually from 2011-2013. The gross tax gap has three components: non-filing, underpayment, and underreporting, of which underreporting makes up 80 percent. Income underreporting on income tax returns has implications for income tax collection at the state level.
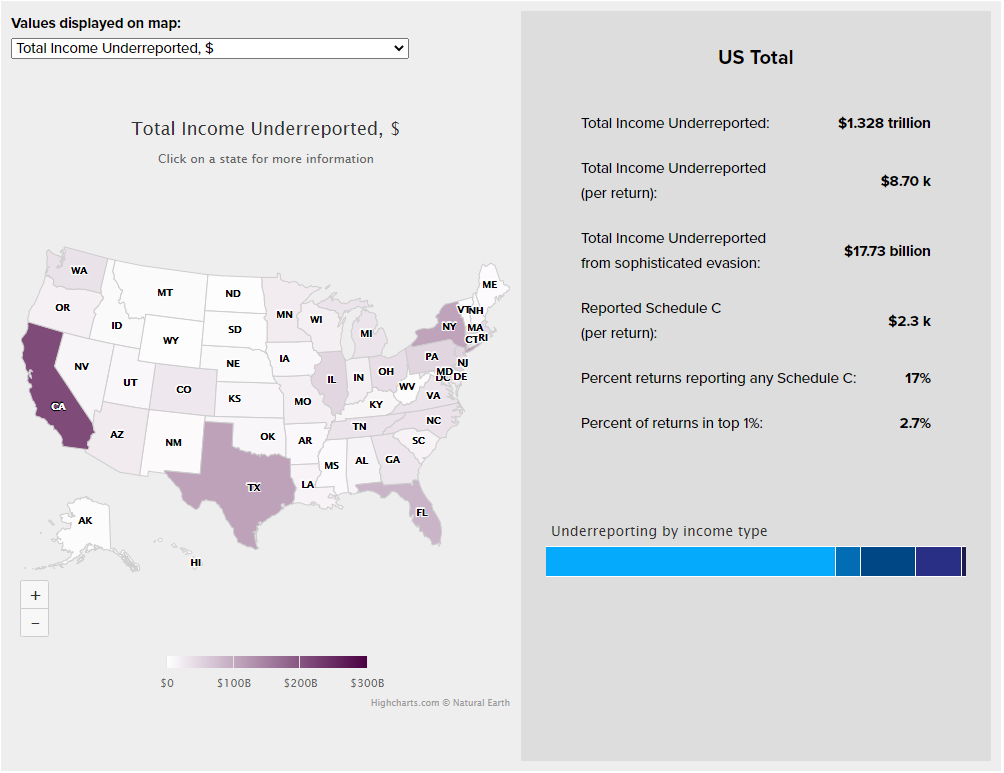
Combining SOI aggregate data for tax year 2018 with new estimates of income underreporting, Figure 1 presents a map of state-level data with PWBM’s estimates of income underreporting and related trends. Use the drop-down menu to choose between which estimate or statistic the map displays. All numbers are for tax year 2018.
Please view online for interactivity.
(per return):
from sophisticated evasion:
(per return):
We estimate $1.33 trillion of income goes underreported on federal income tax returns. Nationally, we estimate that Schedule C business income constitutes 69 percent of underreported income in 2018. Underreporting of Partnership and S-Corp income is 13 percent of total underreporting, and 11 percent is underreporting of financial income (capital gains, dividends, and interest).1 States with high levels of reported Schedule C income are the same states with high per-return income underreporting (a 1 percentage point increase in average schedule C income per return predicts a 0.96 percentage point increase in total per-return underreporting). However, states with high rates of schedule C filers are not the same states with high reported (and therefore underreported) amounts of Schedule C income (correlation between the two is 0.25).
Further, states with higher percentages of returns in the highest AGI groups are also correlated with high per-filer underreporting from sophisticated evasion (with a correlation of 0.76). This result accords with Guyton et al. (2021)’s findings of sophisticated evasion practices among the top 1 percent.
SOI historical table 2 has aggregate amounts of reported income of major income types, presented by state and by AGI class. For income types that are net values (capital gains income, partnership and S-corp income, and Schedule C business income) we adjust using national aggregates from SOI Table 1.4 to produce estimates of positive income.2
To these income amounts, we apply estimates of income underreporting rates from Guyton et al. (2021). These multipliers come from IRS estimates of income underreporting from the National Research Program with detection-controlled estimation (DCE) correction. Income type-specific estimates of underreporting rates are presented separately for the top 1 percent by total true income and the full population. We apply these rates to income reported in the SOI bulletin based on their Adjusted Gross Income (AGI) class. In 2018, the top 1 percent of the overall income distribution were families with AGI above $488,000; we apply underreporting factors to the SOI aggregates AGI groups with $500,000 AGI and above (top 1 percent) and all lower AGI groups are presumably the bottom 99 percent.3
We present underreporting estimates for the following income types: Wages and salaries, capital gains, income from partnerships and S-corps, dividend income, Schedule C business income, interest income, and other income (which is comprised of Pensions and IRA distributions, Social Security, unemployment income, and income from state and local tax refunds).4
The above methodology produces income-specific estimates of tax evasion in accordance with DCE-corrected IRS detection. To account for Guyton et al. (2021) benchmark estimates of sophisticated evasion, we apply the ratio of their benchmark estimates to the DCE-corrected evasion estimates separately between the top 1 percent and the 99 percent to compute sophisticated evasion totals. We distribute the sophisticated evasion totals proportionally between capital gains income, interest income, dividend income, and pass-through business income.
This analysis was conducted by Victoria Osorio. Prepared for the website by Mariko Paulson.
-
These estimates of underreporting by income type are proportional, on average, to the amount of each income type reported in the SOI aggregates in that state. ↩
-
In SOI Table 1.4, net gains and net losses are aggregates of returns with a net gain and net loss, respectively. Even the sum of net gains are net values offset by losses within each return. As a result, these estimates of positive income are effectively lower-bound estimates, as we cannot accurately estimate the amount of positive income from the aggregates of net values. ↩
-
The underreporting rates calculated by [GLRRZ21] are reported separately between the top 1 percent and full population as ranked by true income. The SOI aggregate data only observes reported income, and so we apply the income-specific underreporting rates according to the tax return’s place in the reported income distribution. ↩
-
While Guyton et al. (2021) estimates also present underreporting rates for some additional minor income types such as rental income, the aggregates for these income types are not provided in the SOI data and therefore we cannot include them in our analysis. Further, we are unable to estimate overreporting of deductions and credits, which would further increase estimates of income underreporting. ↩
    US Total	1327955476.79381	8.70	17733000	0.69	0.06	0.13	0.11	0.01	2.3	0.17	0.027
    AK	2990569	8.57	27595.23	0.76	0.05	0.12	0.07	0.007	2.4	0.16	0.007
    AL	12503364	6.06	140991.9	0.69	0.07	0.15	0.08	0.01	1.6	0.17	0.006
    AR	7820082	6.32	81407.79	0.67	0.06	0.13	0.13	0.008	1.6	0.17	0.006
    AZ	23416401	7.57	259843.6	0.69	0.06	0.13	0.11	0.01	1.9	0.16	0.008
    CA	2.12E+08	11.69	2993563	0.72	0.05	0.12	0.1	0.009	3.3	0.19	0.016
    CO	28341541	10.25	307236.9	0.68	0.05	0.15	0.11	0.008	2.7	0.18	0.012
    CT	22759353	12.87	371102.4	0.72	0.05	0.09	0.12	0.012	3.7	0.16	0.019
    DC	4955580	14.16	110950.1	0.71	0.05	0.13	0.1	0.013	4.1	0.19	0.022
    DE	2918187	6.21	27408.62	0.66	0.07	0.15	0.1	0.013	1.6	0.13	0.007
    FL	87620758	8.57	1478852	0.6	0.05	0.19	0.15	0.013	1.9	0.22	0.011
    GA	29936436	6.53	411566.1	0.63	0.07	0.18	0.11	0.01	1.5	0.23	0.009
    HI	6093031	8.77	55996.13	0.77	0.05	0.09	0.08	0.01	2.6	0.16	0.006
    IA	9350302	6.41	80508.42	0.67	0.07	0.15	0.1	0.009	1.6	0.14	0.006
    ID	6179570	7.89	61581.65	0.65	0.05	0.19	0.1	0.008	1.9	0.17	0.007
    IL	48310502	7.9	714998.6	0.65	0.07	0.14	0.13	0.011	2	0.16	0.011
    IN	18927363	6.01	192376.1	0.68	0.07	0.16	0.08	0.009	1.6	0.13	0.006
    KS	10255857	7.68	114531.5	0.68	0.06	0.15	0.1	0.008	2	0.15	0.008
    KY	12094406	6.29	113066.7	0.71	0.06	0.12	0.1	0.008	1.7	0.15	0.005
    LA	14013871	7.14	178537.5	0.7	0.06	0.16	0.07	0.009	1.8	0.2	0.007
    MA	42721495	12.25	686141.3	0.7	0.05	0.12	0.12	0.009	3.4	0.16	0.017
    MD	24848879	8.27	335788.6	0.7	0.07	0.14	0.09	0.012	2.2	0.2	0.011
    ME	5554341	8.33	37503.8	0.77	0.05	0.1	0.08	0.007	2.4	0.17	0.006
    MI	32301363	6.75	375810.5	0.69	0.06	0.14	0.1	0.01	1.8	0.15	0.007
    MN	21892373	7.83	239131.5	0.67	0.07	0.16	0.1	0.009	2	0.15	0.01
    MO	19314948	6.87	214226.1	0.69	0.06	0.14	0.1	0.01	1.8	0.15	0.007
    MS	6765406	5.51	66353	0.73	0.06	0.13	0.07	0.009	1.5	0.19	0.004
    MT	4361657	8.53	46509.12	0.68	0.04	0.17	0.11	0.008	2.2	0.17	0.007
    NC	33589710	7.24	342467.5	0.7	0.06	0.14	0.09	0.009	1.9	0.18	0.008
    ND	2732818	7.51	28442.2	0.65	0.06	0.18	0.1	0.007	1.9	0.15	0.009
    NE	5882278	6.47	59311.96	0.62	0.07	0.18	0.12	0.009	1.5	0.15	0.007
    NH	8020313	11.26	91136.07	0.79	0.05	0.06	0.09	0.007	3.5	0.15	0.01
    NJ	49169118	11.02	712441.8	0.72	0.06	0.12	0.08	0.01	3.2	0.16	0.016
    NM	5613929	6.04	51036.78	0.73	0.06	0.11	0.09	0.01	1.7	0.15	0.005
    NV	11361987	7.84	181158	0.62	0.05	0.16	0.16	0.011	1.8	0.17	0.009
    NY	1.08E+08	11.1	1986214	0.68	0.05	0.13	0.12	0.012	3	0.17	0.015
    OH	38470307	6.84	391477.8	0.72	0.06	0.12	0.09	0.009	1.9	0.14	0.007
    OK	11092706	6.76	109673.6	0.7	0.06	0.14	0.09	0.009	1.7	0.18	0.007
    OR	17361591	8.83	155588.9	0.71	0.05	0.14	0.1	0.009	2.4	0.15	0.008
    PA	49184753	7.86	562376.5	0.72	0.06	0.11	0.1	0.01	2.2	0.13	0.009
    RI	4405489	8.13	43183.12	0.74	0.06	0.11	0.09	0.008	2.3	0.15	0.008
    SC	15302737	6.72	166094	0.69	0.06	0.15	0.09	0.011	1.7	0.17	0.007
    SD	3271281	7.77	34756.08	0.63	0.05	0.19	0.12	0.007	1.9	0.15	0.008
    TN	31529782	10.32	417354.7	0.81	0.04	0.07	0.07	0.005	3.3	0.19	0.008
    TX	1.10E+08	8.73	1442640	0.72	0.06	0.12	0.1	0.007	2.4	0.21	0.011
    UT	9117265	6.69	111141.1	0.56	0.07	0.25	0.12	0.009	1.4	0.16	0.009
    VA	31886894	8	401657.3	0.67	0.07	0.14	0.1	0.012	2.1	0.16	0.01
    VT	2941828	8.95	20672.3	0.75	0.04	0.09	0.1	0.007	2.6	0.18	0.006
    WA	34360333	9.48	430968.9	0.67	0.06	0.13	0.13	0.008	2.5	0.14	0.014
    WI	18978468	6.6	198468.4	0.66	0.07	0.16	0.1	0.01	1.7	0.12	0.007
    WV	3986776	5.21	34785.45	0.75	0.07	0.1	0.07	0.009	1.5	0.12	0.004
    WY	2490396	9.11	36828.82	0.59	0.05	0.17	0.17	0.01	1.9	0.16	0.01