
Key Points
- Penn Wharton Budget Model’s Tax Policy Simulator allows users to see the budgetary and economic impact of Hillary Clinton’s, Donald Trump’s and the House GOP’s tax plans. Users can vary the key economic behavioral assumptions, for a total of 512 combinations.
- In the short run, Hillary Clinton’s tax plan dampens economic growth. However, in the long run her tax plan increases economic growth relative to current policy because her tax plan reduces federal debt relative to current policy.
- In the short run, Donald Trump’s tax plan boosts economic growth. However, in the long run, his tax plan reduces economic growth compared to current policy because his tax plan increases federal debt relative to current policy.
Penn Wharton Budget Model’s Tax Policy Simulator
MATERIAL IN THIS BRIEF IS NOW OUTDATED. AN UPDATED SIMULATOR IS AVAILABLE HERE.
Introduction
Penn Wharton Budget Model’s (PWBM) tax policy simulator allows policymakers, members of the media, and the general public to see the impact that potential reforms to tax policy will have on the federal budget and the economy. The tax policy simulator produces static revenue estimates and dynamic that include the impact on the economy. The static estimates are consistent with the static revenue projections and marginal tax rates prepared in partnership with the Tax Policy Center (TPC), supplemented with some series from the PWBM microsimulation model for creating a debt series. The dynamic results are produced by the PWBM dynamic model that is integrated on top of the static model.
Tax policy proposals include Hillary Clinton’s, Donald Trump’s and the House GOP’s tax plans. The tax policy simulator allows users to select from 512 different combinations of key parameter values to see how they impact the economic outcomes of each tax plan. The parameter assumptions users can vary are the openness of the U.S. economy to international capital flows, the responsiveness of labor to changes in after-tax wages, the responsiveness of savings to changes in interest rates, and potential changes to government outlays (spending) that could offset the deficit effects of changes to tax policy.
The PWBM dynamic model has several unique features that makes it suitable for analyzing the tax plans being considered. First, the model allows for an unbalanced tax change, where the new proposed tax system might generate more revenue (as in the case of Clinton’s tax plan) or less revenue (as in the case of Trump’s tax plan) relative to current policy. Our analysis, in particular, overturns the conventional wisdom that a tax reduction must produce a positive dynamic score. In particular, if the tax cut substantially increases government debt, it then can produce a negative dynamic score, as the debt competes with private capital for household savings and international capital flows. Second, our model carefully analyzes key features of the U.S. tax system. On the international side, the U.S. system is hybrid (part residential, part territorial) tax system. On the corporate side, our tax system includes accelerated depreciation allowances (also known as expensing) that distinguishes between old and new capital investments, as well as pass-through provisions relevant to companies that are not organized as C corporations.
Hillary Clinton’s Tax Plan: Overview of Main Features
Presidential candidate Hillary Clinton has proposed a series of tax changes that would raise taxes on high-income filers, increase the child tax credit, estate taxes, and gift taxes, and reform capital gains taxes and international tax rules for corporations. Based on the tax proposals Clinton announced as of October 11, 2016, the top 1 percent of households would pay more than 90 percent of Clinton’s total tax increases. Clinton’s proposals would decrease incentives for high-income households to work, save, and invest. On average, the proposals would increase after-tax income for low- and middle-income families, with households in the lowest income quintile seeing the largest average benefit as a percentage of after-tax income (nearly a 1 percent increase).
Specifically, Clinton proposes a 4 percent surcharge on adjusted gross income (AGI) above $5 million, requiring filers with AGI greater than $1 million to pay a 30 percent effective tax rate (i.e., the “Buffett Rule”), limiting the tax value of specified exemptions and deductions to 28 percent, and increasing the estate tax. All of these proposals would increase taxes on high-income taxpayers. In 2017, taxpayers in the top 1 percent of the income distribution (those with incomes above $700,000 in 2016 dollars) would see their tax burdens increase more than $117,000, a reduction in after-tax income of 7 percent. According to estimates by the Tax Policy Center, under current law, the top 1 percent already pay about 27.9 percent of federal taxes, while the top 10 percent already pays about 53.7.
The effect of Clinton’s proposals on all other taxpayers would be relatively modest. On average, filers in the bottom 80 percent of the income distribution (income under $140,000) would see a small increase in after-tax income (averaging no more than 1 percent). Filers in the lowest income quintile would receive an average tax cut of $100 (or a 0.7 percent increase in after-tax income). The biggest change for these households is Clinton’s proposal to increase and expand the child tax credit.
More information on Hillary Clinton’s tax plan proposals can be found in analysis by the Tax Policy Center and on the Hilary Clinton campaign web pages "The Briefing" and "Issues."
Donald Trump’s Tax Plan: Overview of Main Features
Presidential candidate Donald Trump has recently proposed a series of new tax changes that would reduce marginal tax rates, increase standard deduction amounts, repeal personal exemptions, cap itemized deductions and allow businesses to elect to expense new investments and not deduct interest expense. The tax plan reduces taxes at every income level, but high-income taxpayers receive the biggest cuts, both in dollar terms and as a percentage of income.
Specifically, for individuals Trump proposes to reduce the top income tax rate to 33 percent, increase the standard deduction, add a new deduction and other tax benefits for child and dependent care, and repeal personal exemptions and the head of household filing status. The tax plan would eliminate the alternative minimum tax (AMT) and the net investment income tax enacted as part of the Affordable Care Act (ACA). The tax plan would also eliminate the estate and gift taxes, but would tax capital gains (above a large exemption amount) at death.
For businesses, Trump proposes to reduce the corporate rate to 15 percent and allow owners of pass-through businesses to choose to pay a flat tax rate of 15 percent rather than the regular individual income tax rates. “Large” pass-throughs would also pay tax on distributions from the business, but at the favorable rates that apply to dividends. Both corporate and pass-through businesses could elect to immediately deduct (i.e., expense) investment, but would then not be allowed to deduct interest expenses. The tax plan would also repeal certain business tax expenditures.
More information on Donald Trump’s tax plan proposals can be found in analysis by the Tax Policy Center and on the Donald Trump campaign web page.
House GOP’s Tax Plan: Overview of Main Features
The House GOP proposal for tax reform, announced by Speaker of the House Paul Ryan and House Budget Committee Chairman Kevin Brady, reduces tax rates and converts the taxation of business income into a cash-flow consumption tax. The tax plan reduces the top individual income tax rate to 33 percent, reduces the corporate rate to 20 percent, and caps at 25 percent the rate on profits of pass-through businesses (such as sole proprietorships and partnerships) that are taxed under the individual income tax. Individuals could deduct half of their capital gains, dividends, and interest, reducing the top rate on this income to 16.5 percent.
The tax plan increases the standard deduction and child tax credit. It repeals personal exemptions and all itemized deductions except those for charitable contributions and home mortgage interest. The tax plan eliminates the alternative minimum tax (AMT), estate and gift taxes, and all taxes associated with the Affordable Care Act (ACA). Both corporate and pass-through businesses would deduct their investments in plant, equipment and inventories, but could no longer deduct interest expense. The tax plan includes border adjustments by including imports and excluding exports from the base of the business-level tax. The tax plan moves the US tax system to a destination-based tax system in which only income from sales to US consumers are taxable.
More information on the House GOP’s tax plan proposals can be found in analysis by the Tax Policy Center in the tax plan blueprint.
The PWBM Models: Overview
The static version of the PWBM simulations shows the direct impact that each tax plan will have on federal government revenues, federal government outlays, and the federal debt. The dynamic version shows the budgetary and economic effects of tax policy changes, including the impact on the economy of households responding to changes to tax policy by changing how much they work, save, and consume.
The static version of the Penn Wharton Budget Model uses what is known as a “stochastic simulation.” Hundreds of thousands of individuals across a wide range of population subgroups are calibrated to Census-level data. Using a variety of additional large data sets, households are assigned key economic attributes including fertility, mortality, immigration, labor-force participation rates, education, marriage, divorce, capital, disabilities, and earnings.
Households are then subject to various life events: They grow up, go to school, get married, maybe divorce, get jobs, pay taxes, and eventually retire and receive benefits. The model is first tested using historical data before being used to make projections of policy changes. For the purpose of this exercise, PWBM’s tax policy simulator’s static and dynamic results are based on revenue projections and marginal tax rates estimated by the Tax Policy Center’s (TPC) static microsimulation model.
The dynamic PWBM is based on an overlapping-generations (OLG) model where households maximize their welfare in a forward-looking manner. Households make choices, for instance about how much to work and save, given wages and interest rates. These choices are made given the amount of time, assets, technology, and skills that households’ possess and the prices, wages, interest rates and uncertainties that households’ face, both today and in the future. When wages and interest rates change, as a result of changes to tax policy, it can impact how much a household chooses to work and save.
The dynamic version of the model also includes numerous types of households, and it allows households to respond to policy changes by altering their economic choices – labor supply, consumption, and saving. These feedback effects may reinforce or offset the direct effects of tax policy changes on the size of the economy, economic growth, distribution of income, and federal revenues. Importantly, as noted earlier, the PWBM model allows for unbalanced tax reforms that increase or decrease government debt.
Integration between PWBM’s dynamic model and static model are achieved by first running the OLG model in “static” mode and then running the model in “dynamic” mode. The differences between the two are then layered on top of the static microsimulation results. This approach captures the richness of detail in the microsimulation model along with the behavioral changes observed in the OLG model.
The Key Economic Assumptions: The Dial Controls
The parameter assumptions users can vary are the openness of the U.S. economy to international capital flows, the responsiveness of labor to changes in after-tax wages, the responsiveness of savings to changes in interest rates, and potential changes to government outlays (spending) that could offset the deficit effects of changes to tax policy. Parameter choice ranges are based on findings in the economic literature. A brief description of the parameters and their role in framing the effects of policy changes is provided in a PWBM Brief: Setting Behavioral Responses in PBWM’s Dynamic Simulations.
The dial control governing foreign investment flows into U.S. measures the share of new issues of U.S. financial assets that foreign savers purchase. If foreign flows offset 100 percent of a change in national saving, domestic investment is unaffected by larger deficits or surpluses produced by a tax plan. If there is no offset, changes in national saving lead to equal changes in domestic investment. Setting the dial at 40 percent means that 40 percent of each dollar of budget deficits is financed by foreign capital inflows, with the other 60 cents funded out of domestic saving. U.S. Treasury Department data show that since the year 2000, foreign savers purchased about 40 percent of annual increases in Treasury security issues. Estimates of foreign investment in private assets are lower. PWBM’s baseline setting for foreign investment flows into U.S. is 40 percent.
Changes to tax policy can affect after-tax wages. The labor supply elasticity dial control measures how labor supply responds to changes in after-tax wages, holding total wealth constant. A higher labor supply elasticity setting implies a stronger labor supply response to changes in taxes on labor income. Individuals can change the amount they work by either changing the number of hours they work or by choosing to enter or exit a job. A lower setting dampens the labor supply response. Studies that compare individuals suggest that the labor supply elasticity for men lies between 0.0 and 0.1, as a short run response. In words, a value of 0.1 means that male labor supply increases by 0.1 percent as their after-tax income increases by 1 percent. For women, the elasticity ranges from 0.2 through 0.5. The elasticity for women has been declining, reflecting stronger labor-force attachments during recent decades. However, other empirical studies compare labor supplies across countries with different wages, which better reflect labor supply responses over the long run. Such studies estimate the labor supply elasticity to be slightly more than 1.0, although larger values have also been found. PWBM’s baseline setting for labor supply elasticity is 0.5.
Changes to tax policy can affect net-of-tax interest, dividends and capital gains. The savings elasticity dial control measures how national saving responds to a change in the return to saving. A higher saving elasticity setting implies a stronger savings response to changes in after-tax returns. A lower setting dampens the savings response. Most saving elasticity estimates suggest a low value – well below 1.0. Studies based on changes in taxes and income tax rebates report estimates less than 0.5. Studies based on appropriately calibrated computable life-cycle models of consumer behavior, which account for alternative saving responses, estimate the saving elasticity to be 0.65. PWBM’s baseline setting for savings elasticity is 0.5.
Changes in federal revenues that are not offset by changes in outlays affect investment and economic growth through their impact on federal deficits and debt. The change in federal outlays dial control illustrates a change in federal outlays to offset the effects of tax changes on the deficit and the economy. Spending on Social Security and Medicare is excluded from any changes, and the effects of changes in spending on particular programs is not taken into account. PWBM’s baseline setting for change in federal outlays is 0 or no change.
The Results: GDP Growth under Baseline Assumptions
In the near-term, relative to current policy, the Trump and House GOP tax plans increase the size of the economy while the Clinton tax plan constricts economic growth, under our baseline assumptions. By 2018, the PWBM projects that the Trump tax plan will increase GDP by about 1.12 percent, relative to the value it otherwise would have been in that year under current law. We project that the Clinton tax plan will decrease GDP by 0.19 percent, relative to current law.
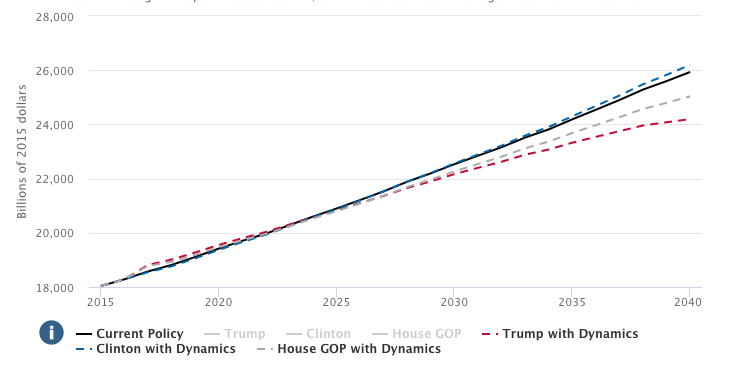
By 2027, however, the results are largely reversed: We project that the Clinton tax plan will lead to a 0.40 percent larger GDP relative to current law, while the Trump tax plan will lower GDP by 0.43 percent. Over the even longer run, the Clinton tax plan leads to higher Gross Domestic Product (GDP) than do the Trump and House GOP tax plans. Figure 1 shows that by 2040 under the Clinton tax plan, GDP will be $43 trillion while under the Trump tax plan GDP will be $39 trillion. Hours worked and capital services under the tax plans show similar patterns as GDP in the short- and long-run. Tax cuts in the Trump and House GOP tax plans initially provide incentive for more work and investment, but in the long-run the impact of federal debt crowds out domestic saving.
Figure 1: Gross Domestic Product - Baseline Settings
The longer-run differences in the tax plans are mostly driven by differences in debt accumulation, as the Trump tax plan increases it while the Clinton tax plan decreases it. In general, relative to current policy, Figure 2 shows that the Clinton tax plan lifts government revenues while the Trump and House GOP tax plans lower government revenues. The dynamic results show that when households respond to changes in tax policy, all three tax plans produce more revenue than indicated by the static results, over the short run. In the long run, however, the dynamic revenue estimates for the Trump and House GOP tax plans fall below their static estimate, due to the negative impact that rising debt has on the economy. In contrast, the dynamic revenue estimate for Clinton’s tax plan rises above its static estimate.
Figure 2: Revenues - Baseline Settings

Robustness of the Results to Different Assumptions
The PWBM simulator allows users to see the impact of tax reform under different economic assumptions. For the unbalanced reforms considered herein, the most important assumption is the assumed rate of foreign investment flows into the United States. As government debt increases, more household savings is diverted to financing it rather than private capital formation, which dampens economic growth. However, if foreign investment flows into the U.S. offset some of the declines in domestic saving going to capital formation, domestic capital formation need not decline as much and economic growth need not be substantially hampered. However, there will still be a negative impact on the U.S.’s financial account balance.
Setting foreign investment flows to zero percent means that new government debt will significantly reduce the amount of domestic investment. Setting foreign investment flows to 100 percent means that new government debt will not reduce domestic investment since any imbalance is made up in foreign investments. Research indicates that neither setting is realistic for the U.S. economy. At our intermediate setting of foreign investment flows at 40 percent, about 40 percent of new government debt will be funded by foreign savers and 60 percent by domestic savers. New government debt will, therefore, still reduce domestic investment.
Varying the assumed foreign investment flows into U.S. has a sizeable impact on the economic outcomes of tax plans that change the amount of federal debt. For example, under the Trump tax plan, if foreign investment is set at 0 percent then by 2027, GDP will be $513 billion less than with foreign investment set at 40 percent. On the other hand, Figure 3 shows that if foreign investment were set at 100 percent, then under the Trump tax plan, in 2027, GDP will be $770 billion more than with PWBM’s baseline assumptions.
Figure 3: Gross Domestic Product - Foreign Investment Flows into U.S. set at 100 percent

Conclusion
In the short run, Donald Trump’s tax plan reduces taxes on business and higher income Americans, boosting investment and work, which results in more economic growth. However, in the long run, the Trump tax plan increases federal debt more than current policy, resulting in less economic growth. The Trump tax plan can increase economic growth in the long run, but only if foreign investment flows are high enough to offset the impact of his tax plan’s higher federal debt.
Hillary Clinton’s tax plan slightly reduces taxes on wage income while increasing taxes on businesses and, in the short run, dampens investment and work, which results in less economic growth. However, in the long run, the Clinton tax plan reduces federal debt relative to current policy resulting in more economic growth. The Clinton tax plan does not need foreign capital to fund domestic investment to boost economic growth in the long run because her tax plan reduces federal debt relative to current policy.
The Penn Wharton Budget Model tax policy simulator shows the impact of each reform proposal on the economy and the federal budget. Users of the model are encouraged to experiment with their own parameter assumption settings.