
Summary
PWBM’s Social Security Simulator allows users to build Social Security reform plans to see the impact of those plans. Policymakers, major media outlets and that leaders who want to test different Social Security reforms can contact us.
Key Points
Penn Wharton Budget Model’s updated Social Security Simulator allows users to build Social Security reform plans to see the budgetary and economic impact of those plans.
Users can try up to 648 different policy combinations.
The model can handle a much wider range of Social Security policy options, which are not shown to conserve space. Policymakers, major media outlets and thought leaders who want to test different Social Security reforms can contact us for estimates.
Penn Wharton Budget Model’s Social Security Simulator
CLICK HERE FOR INTERACTIVE SIMULATION
Introduction
Policymakers and the public can use Penn Wharton Budget Model’s newly updated Social Security Simulator to build their own reform plans. Users can see the projected impact of their plan on the economy and federal budget, including trust fund reserves, benefits, and debt held by the public. PWBM’s previous Social Security simulator focused on the effects to Social Security finances. A PWBM brief shows that Social Security’s financial condition has deteriorated. USAFacts provides historical context for the Social Security system.
Social Security Module
PWBM’s Social Security module is built on top of our updated microsimulation model. Our Social Security module accounts for all portions of OASDI benefits and taxes. Our module includes benefits rules associated with retirees, child and adult (spousal) dependents, widowers, divorced spouses and disabled beneficiaries. The module can handle a comprehensive catalog of Social Security reforms such as changes to the OASDI tax rate and Social Security benefit formula. The methods used to produce our Social Security module are documented in a technical paper.
The Social Security module recognizes that individuals begin to collect Social Security benefits between the age of 62 and 70. The age that individuals begin to collect benefits is modeled according to demographic characteristics including marital status, sex, education and race.
The simulator incorporates PWBM’s dynamic model for macroeconomic feedback effects. Therefore, our results include the impact of growing federal debt under current policy and the impact of policy reforms on federal debt.
The simulator shows the budgetary and economic effects of each reform on its own or with any combination of reforms. PWBM’s Social Security Simulator, therefore, advances our understanding of how the effects of each reform change when combined with different packages of Social Security policy reforms.
PWBM’s Microsimulation Model: Quick Overview
PWBM’s microsimulation includes hundreds of thousands of individuals and families representative of the U.S. population. It is calibrated using Census-level data and a variety of additional data sources. Households are assigned key economic and demographic attributes including fertility, mortality, immigration, labor-force participation rates, education acquisition, marriage, divorce, capital acquisition, disability, wages and non-wage compensation and more. Individuals are subject to various life events: They grow older, go to school, get married, maybe divorce, get jobs, work and earn, pay taxes and eventually retire, receive government benefits (both before and after retirement) and die. Families are formed through marriage, grow larger through childbirth and dissolve through divorce, immigration, emigration and death. We “cross-walk” between IRS Statistics of Income data and Census data to allow us to model policy reforms that affect households with high incomes, such as eliminating the taxable maximum on earned income. The model is validated using an extensive battery of tests on U.S. historical data.
PWBM’s Dynamic OLG Model: Quick Overview
The dynamic version of PWBM is based on an overlapping-generations (OLG) model where households maximize their welfare in a forward-looking manner. Households make choices, for instance about how much to work and save, given wages and interest rates. These choices are made given the amount of income, time, assets, technology, and skills that households possess and the prices, wages, interest rates and uncertainties that households face, both today and in the future. The OLG model allows households to respond to policy changes by altering their economic choices – labor supply, consumption and saving. These feedback effects may reinforce or offset the direct effects of Social Security reforms on the size of the economy, the distribution of income and federal revenues.
PWBM’s dynamic model has features that make it suitable for analyzing Social Security reforms. The OLG model includes numerous types of households that vary by income as well as key demographics. Households face uncertainty today and in the future about their income and longevity. In addition, the PWBM model allows for unbalanced policy reforms that increase or decrease government debt. Social Security provisions are explicitly modeled. For example, benefit calculations are indexed to wage growth by cohort.
The model is calibrated to empirical measures of the responsiveness of labor and savings to changes in after-tax wages and interest rates. The responsiveness of labor to changes in after-tax wages’ default value is 0.5. The responsiveness of savings to changes in interest rates’ default value is 0.5. Users can choose the openness of the U.S. economy to international capital flows. The openness of the U.S. economy to international capital flows’ default value is 40 percent. However, users may use the international capital flow dial control to choose a value of 0, 40, 70, or 100 percent.
Social Security Dial Controls
The Social Security Simulator allows users to vary six key Social Security provisions to build their own reform plans. The simulator includes ideas from recent Social Security reform proposals, that include changes to amount of income subject to payroll taxes and the retirement age.
Figure 1 shows the policy options available on the simulator. Users can select from 648 different combinations of key Social Security reforms to see how they affect Social Security’s finances, the economy and the federal budget. Descriptions of each key Social Security reform can be viewed by clicking on information buttons (blue circle with an i) to the left of each dial control. However, our Social Security model includes many additional capabilities that are not shown on the simulator.
Table 1: Key Social Security Reforms
| Social Security Reforms | |
|---|---|
| OASDI Tax Rate | |
| 12.4% | |
| Progressive Increase | |
| 13.6% | |
| 14.9% | |
| Taxable Maximum Policy | |
| $128,700 | |
| $150,000 | |
| Payroll Taxes on Wage Earnings Above $250,000 | |
| None | |
| ½ OASDI Rate | |
| Full OASDI Rate | |
| Cost of Living Adjustment (COLA) Index | |
| CPI-U | |
| Elderly CPI | |
| Chained CPI | |
| Primary Insurance Amount (PIA) | |
| 90/32/15 | |
| 90/25/8 | |
| 80/22/5 | |
| Full-Benefit Retirement Age (FRA) | |
| 67 | |
| 68 | |
| 70 | |
Effect of Reforms on Key Statistics
The Social Security simulator shows the impact of policy reforms on Social Security’s finances, the economy and the federal budget. As seen in Figure 1, the grey drop down box at the top of the graph shows the economic statistic on the graph. On the simulator, click on the box to pull up a menu of different economic statistics to select from. Some statistics are collapsed under headings and clicking on the heading will expand the list.
Figure 1: Social Security Simulator - Key Statistic Selection
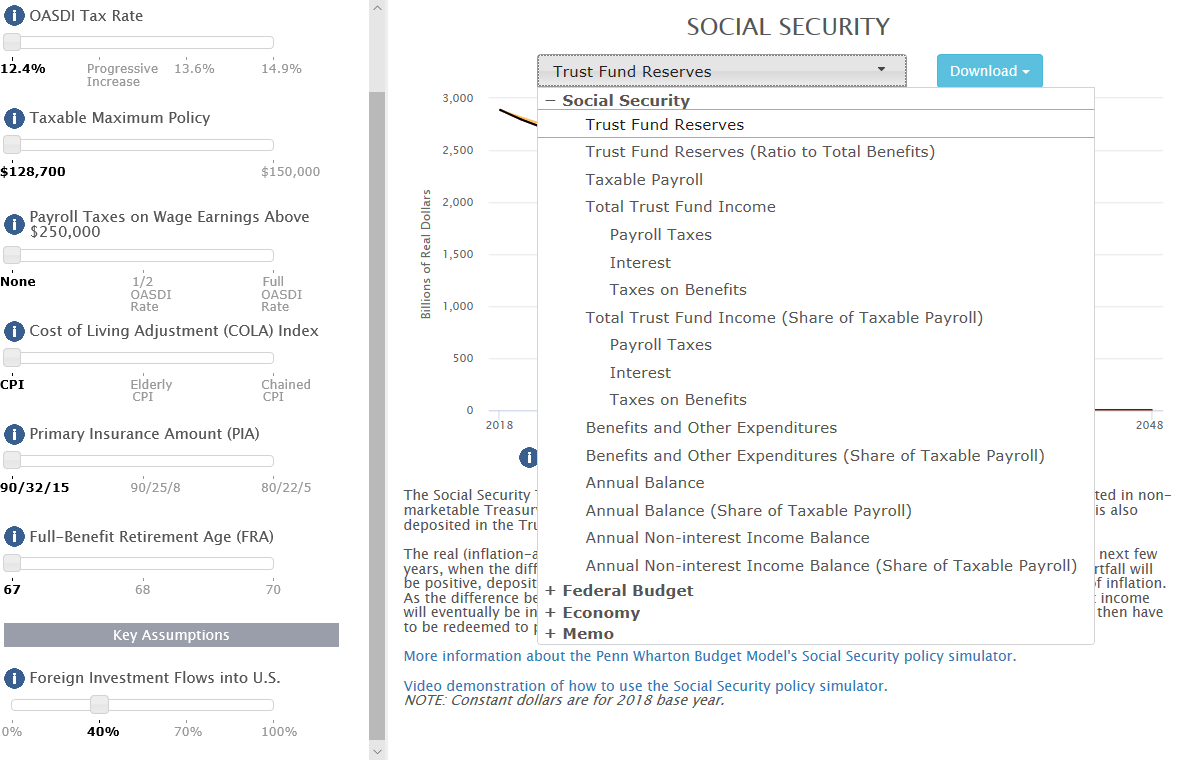
Effect of Reforms on Key Statistics
The “bumps” in the various economic and Social Security statistics between 2022 and 2017 reflects the incentive effects of the Tax Cuts and Jobs Act (TCJA) of 2017. This Act reduced income tax rates on corporations and individuals, that we project will increase capital investment, employment, and wages in the short term. In turn, that would boost the payroll tax base and Social Security’s revenues in the short term. However, several of TCJA’s tax incentives expire by the mid-2020s, causing U.S. domestic investment and wages to decline more rapidly during the latter part of that decade. Our TCJA projections keep adjustment costs turned off, which allows for comparisons with other models that don’t support this level of detail. With positive adjustment costs, economic growth from TCJA would smoother but smaller.
Conclusion
Penn Wharton Budget Model’s Social Security Simulator allows users to see how up to 648 different Social Security reforms affect Social Security’s finances, economic growth, work, saving, and the federal budget. Users of the model are encouraged to experiment by building their own Social Security reform plans. The simulator exposes just the “tip of the iceberg” of the power of the PWBM Social Security’s module. Policymakers, major media outlets and thought leaders who want to test different Social Security reforms can contact us for estimates.