By John Ricco and Mariko Paulson
Penn Wharton Budget Model (PWBM) previously analyzed the effects of the Tax Cuts and Jobs Act (TCJA) on the budget and the economy. One significant change to the individual income tax code under TCJA was the curtailing of itemized deductions. Doubling the standard deduction, capping the deduction for state and local taxes, and eliminating smaller itemized deductions all reduced the share of filers itemizing, from 31 percent in 2017 to just 13 percent in 2018. As PWBM noted last summer, the combination of fewer itemizers and lower marginal rates has scaled back the tax subsidy for charitable contributions, which is expected to modestly reduce total charitable giving made by households. In this post, we analyze policies aimed at expanding charitable giving in the wake of TCJA.
Several federal lawmakers have offered such proposals. Representatives Chris Smith (R-NJ) and Henry Cuellar (D-TX) introduced legislation to move the charitable deduction “above the line” so that tax filers receive the deduction even if they don’t itemize. In 2017, as it became clear that tax reform may curb itemized deductions, Representative Mark Walker (R-NC) authored a bill that would create a new charitable deduction for non-itemizers, with Senator James Lankford (R-OK) introducing a companion bill in the Senate. More recently, Lankford and Senator Chris Coons (D-DE) wrote a public letter to the Treasury asking for real-time data on giving under the concern that it was falling in the wake of TCJA.
Predictably, there is interest in similar reforms among nonprofits. Researchers at the Lilly Family School of Philanthropy partnered with PWBM to analyze a series of reforms proposed by Independent Sector, a nonprofit advocacy organization. As PWBM is a non-normative organization, we merely analyze the policies in our model framework – we do not make recommendations or endorse any specific policy put forth by Independent Sector. Click here to read the Lilly Family School’s report on the policies.
The tax return datasets do not offer information on charitable contributions for returns taking the standard deduction. To impute charitable contributions for non-itemizers, we use the Lilly Family School’s Philanthropy Panel Study, an extension of the Panel Study of Income Dynamics to PWBM’s model. This imputation is key for estimating the effects of policies that extend beyond the current set of households that report donations on their tax returns.
PWBM analyzed five different policies, all aimed at expanding tax benefits for charitable contributions while preserving the current deduction for itemizers:
- A non-itemizer charitable deduction
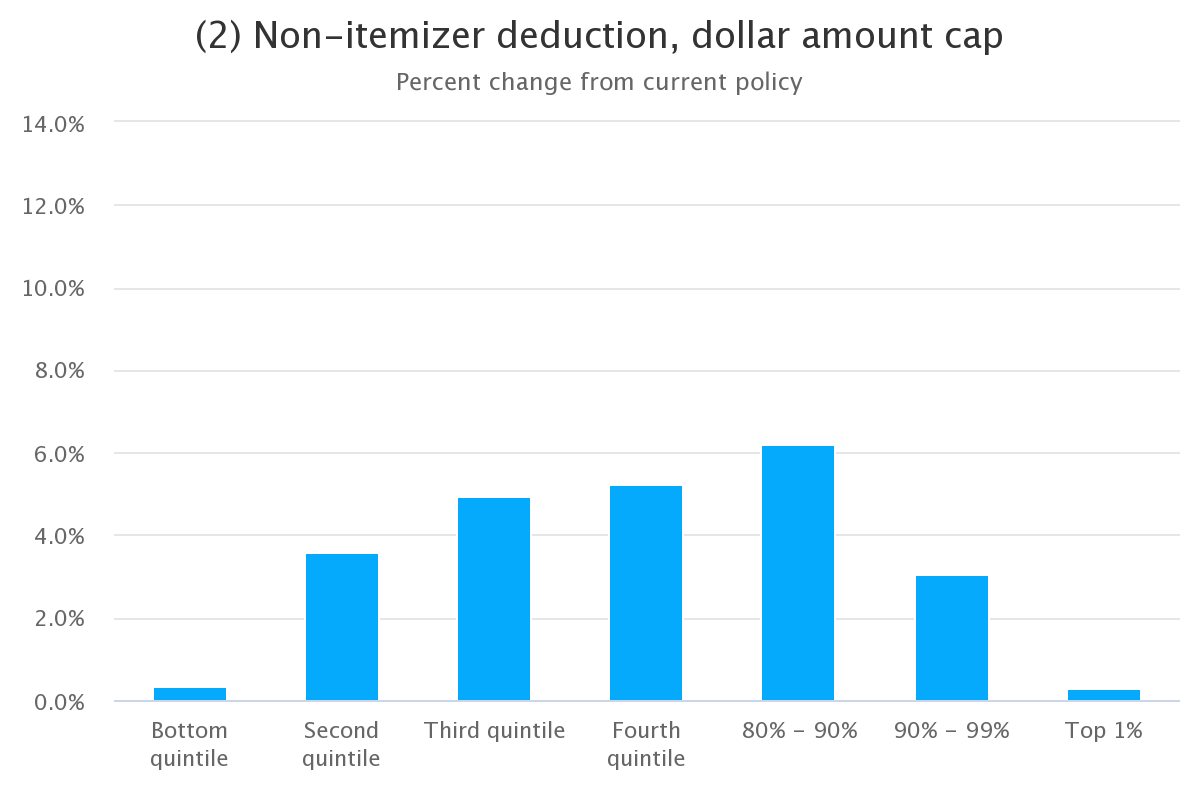
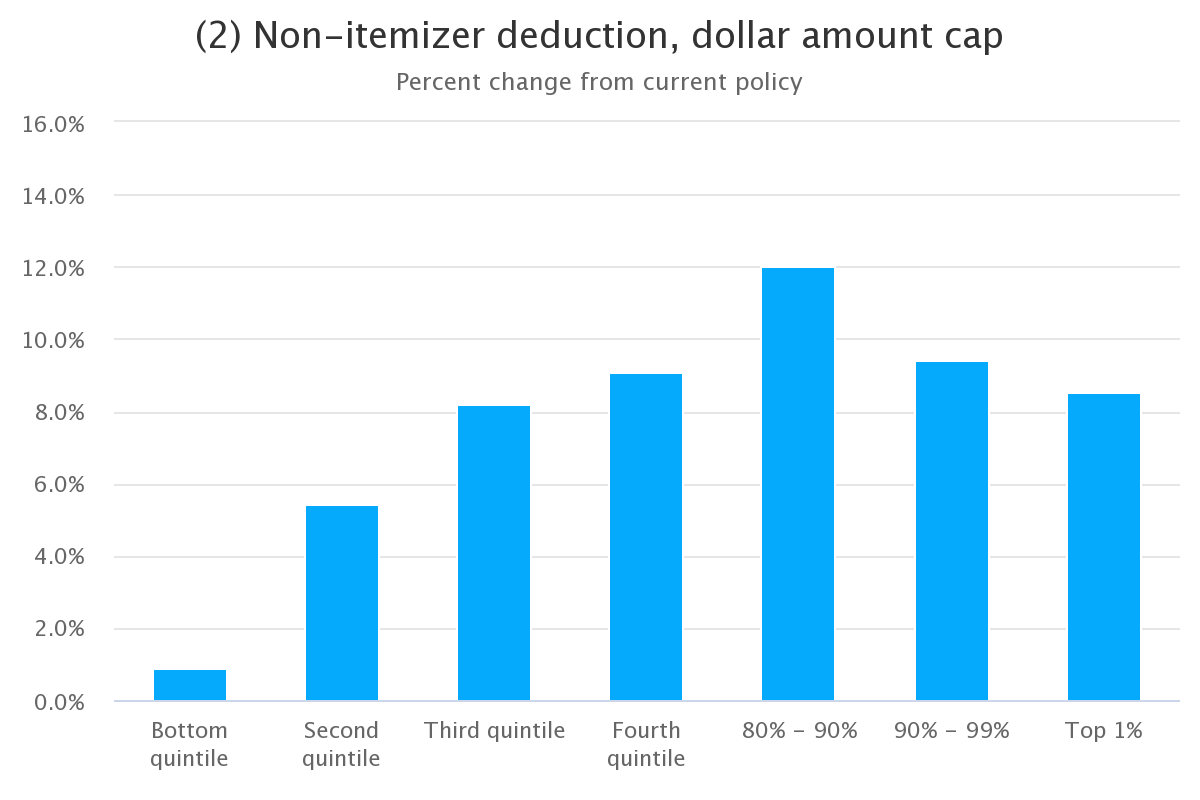
- A non-itemizer charitable deduction with a cap for non-itemizers of $4,000 for single filers and $8,000 for married couples filing jointly
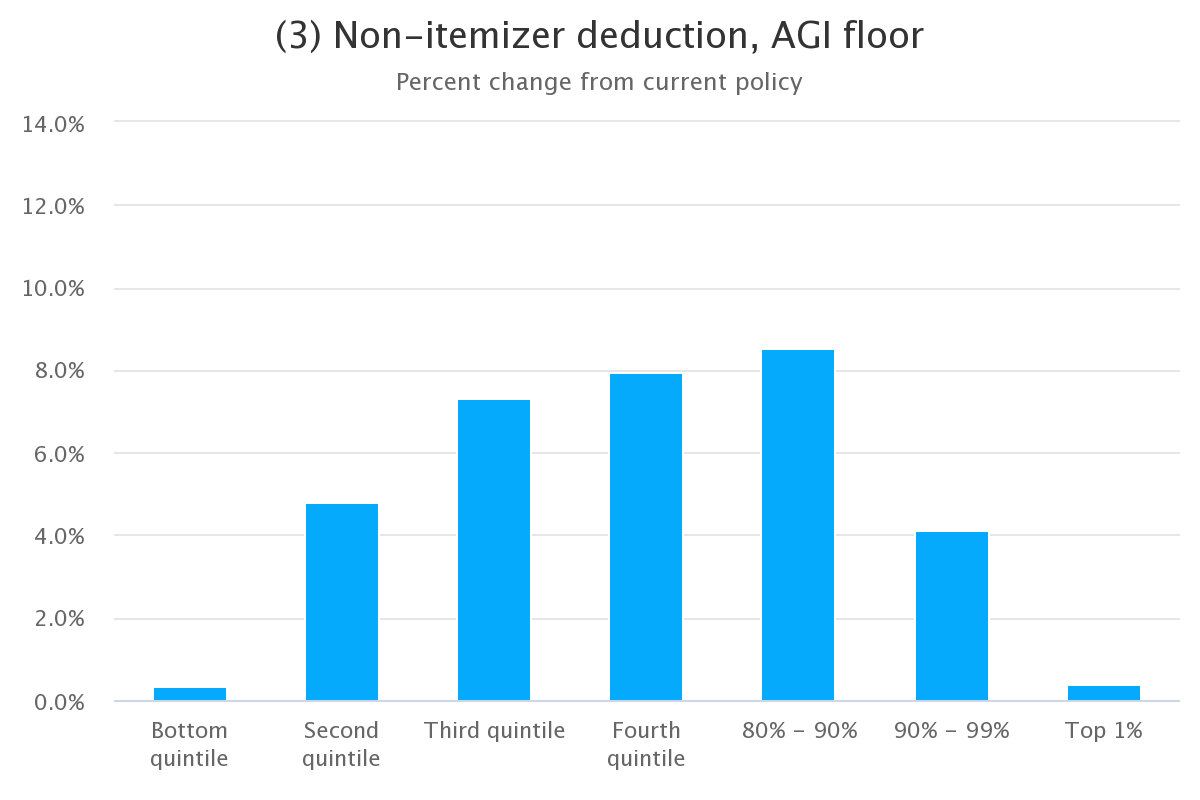
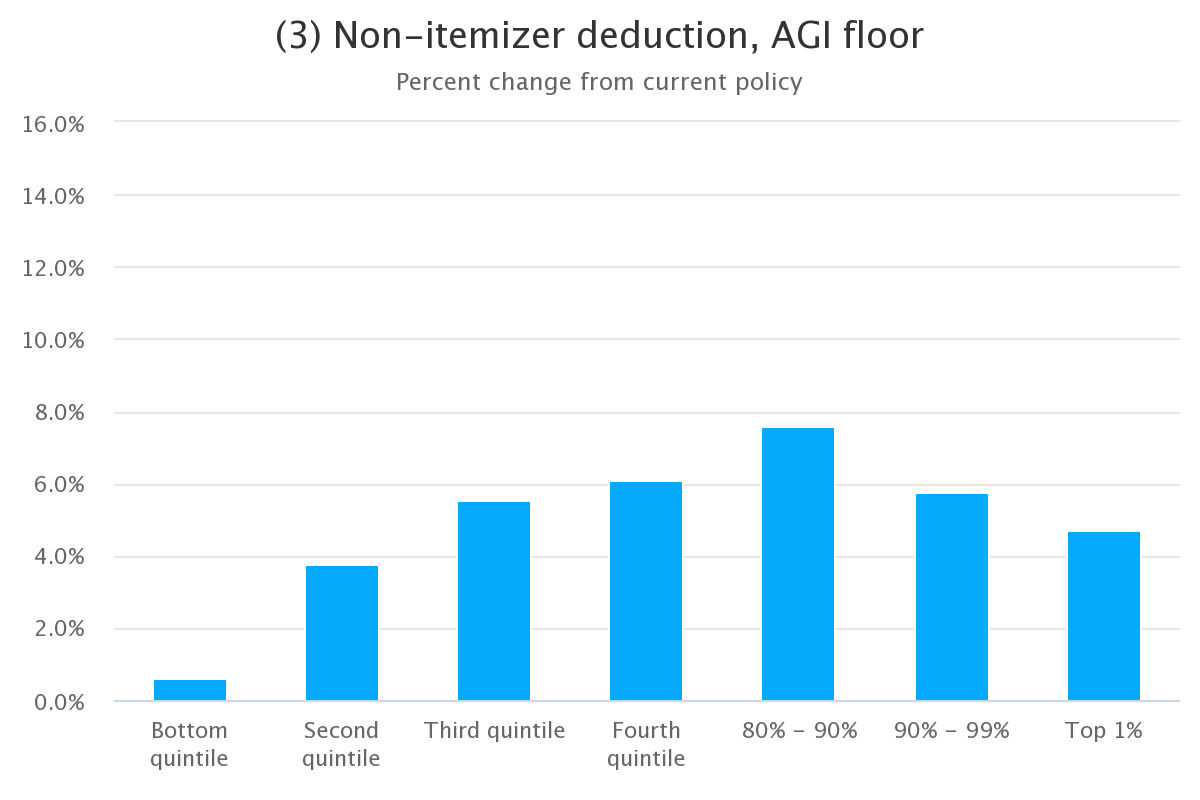
- A non-itemizer charitable deduction with a modified 1 percent floor that allows donors to deduct 50 percent of the value of their charitable gifts if it is below 1 percent of their adjusted gross income (AGI) and the full amount of the donation if it is above 1 percent
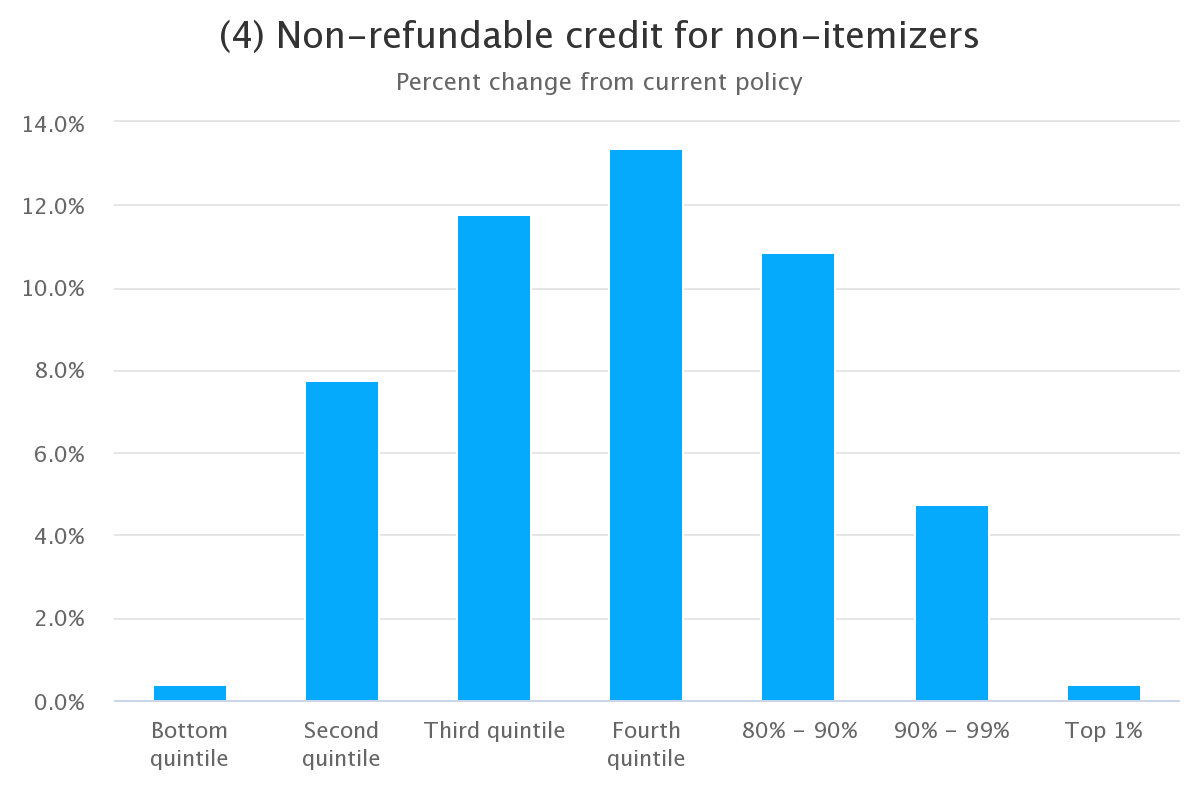
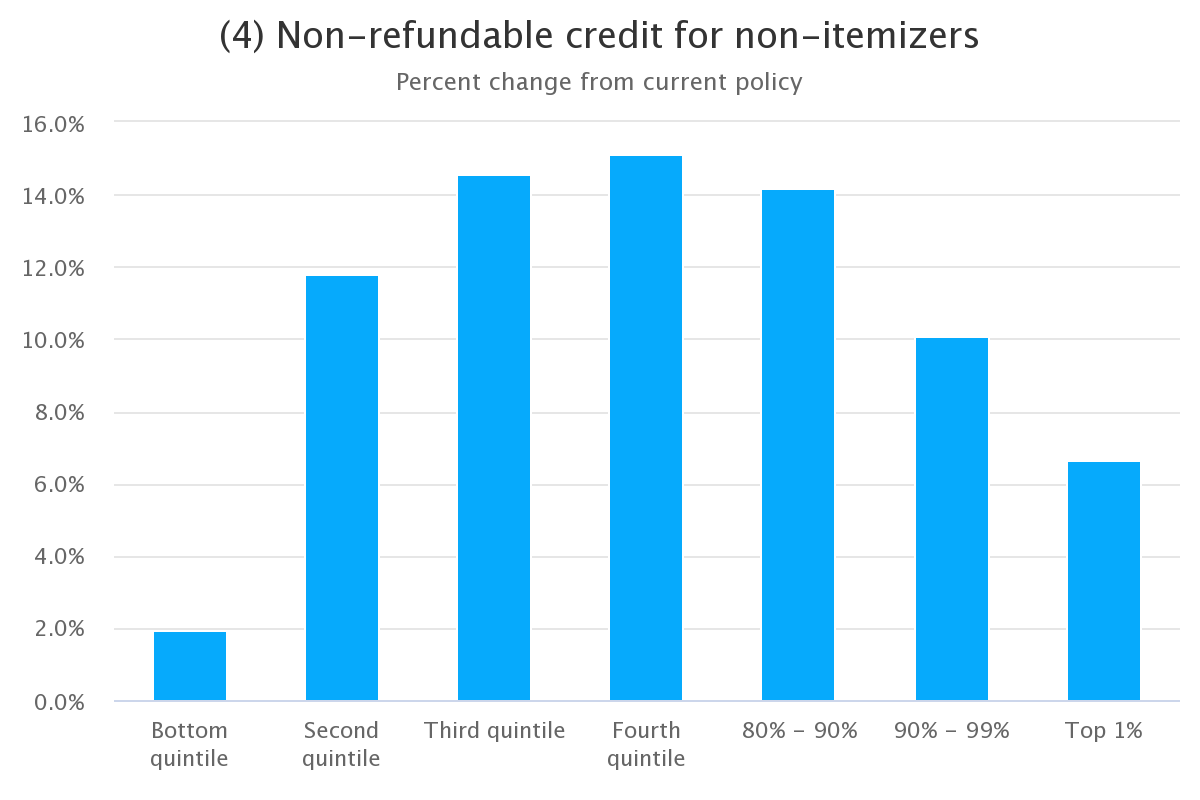
- A non-refundable 25 percent charitable giving tax credit available to nonitemizers
-
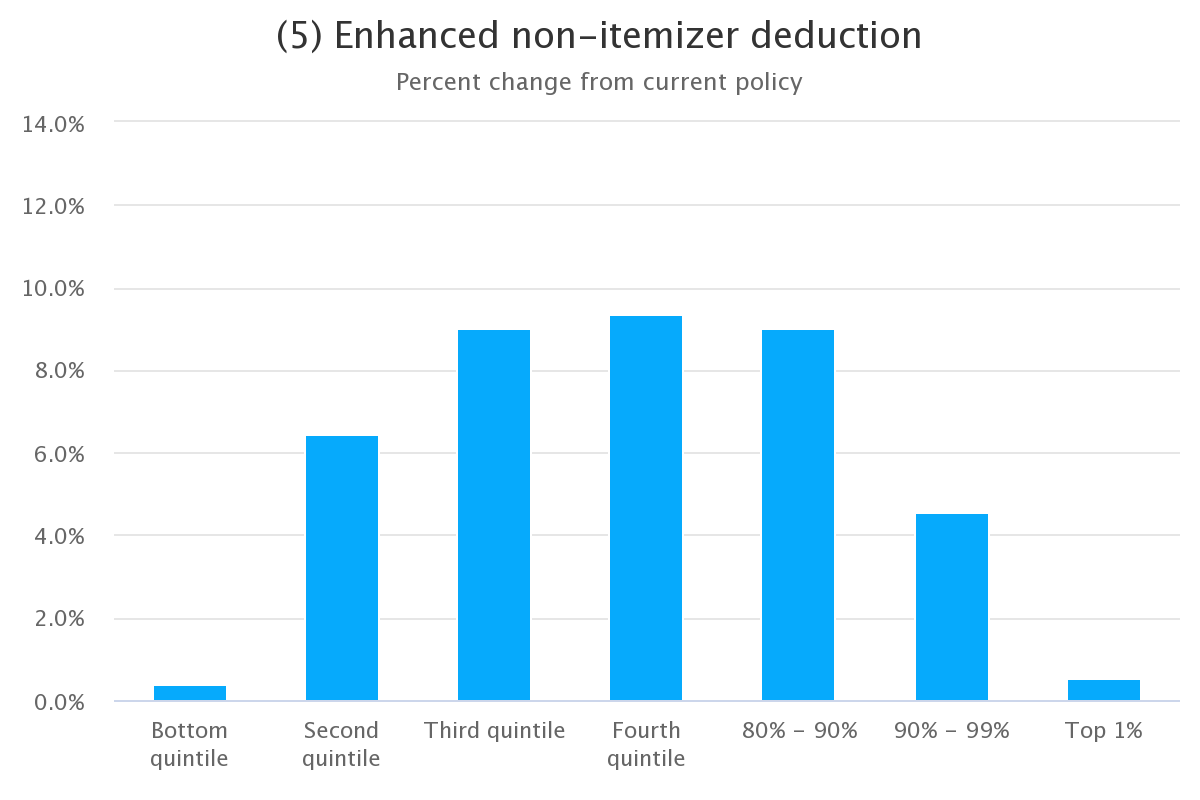
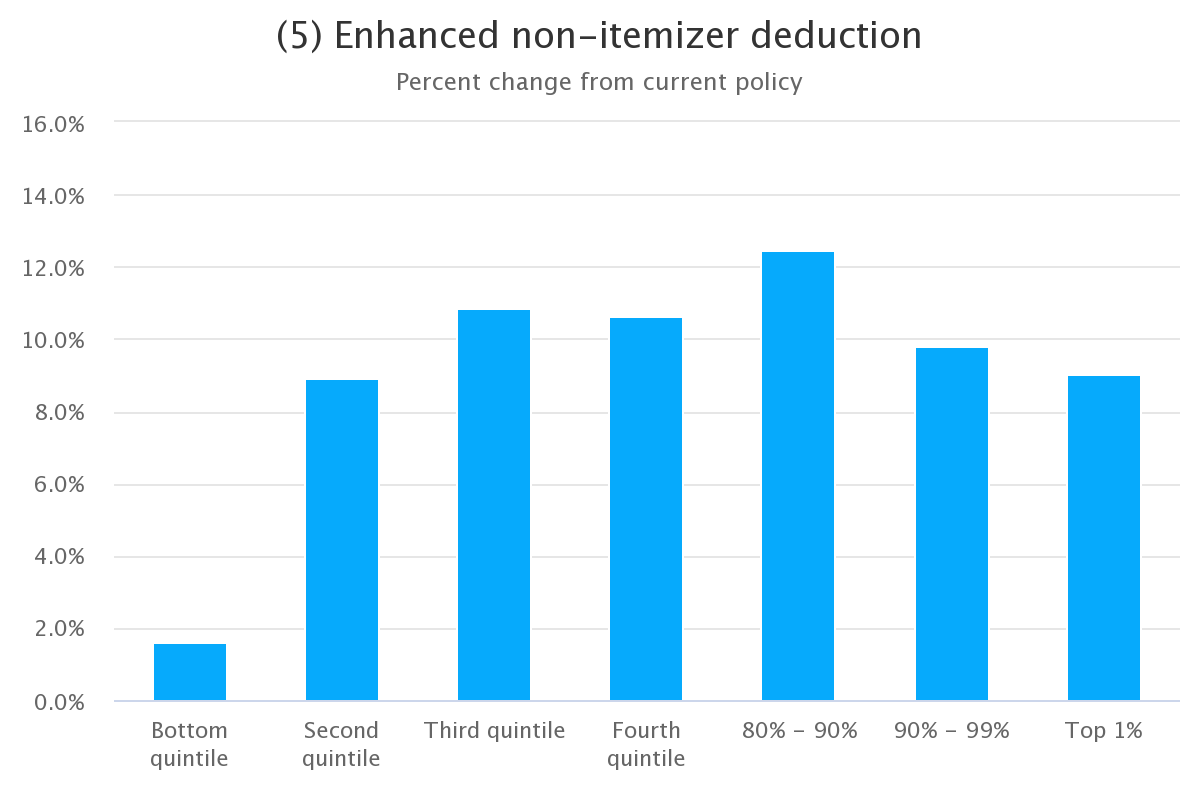
An enhanced non-itemizer charitable deduction, which provides a higher value deduction for low- and middle-income households:
- Single filers earning under $20,000 can deduct 200 percent of the value of their charitable donations, single filers earning between $20,000 and $40,000 can deduct 150 percent of their charitable donations, and single filers earning over $40,000 can deduct 100 percent of their charitable donations
- Married couples filing jointly earning below $40,000 can deduct 200 percent of the value of their charitable donations, married couples filing jointly earning between $40,000 and $80,000 can deduct 150 percent of their charitable donations, and married couples filing jointly earning over $80,000 can deduct 100 percent of their charitable donations
In addition to producing revenue estimates, PWBM projects how each policy affects the amount of charitable contributions and the number of donors, both in aggregate and by income group. We evaluate each policy under three separate assumptions about the responsiveness of giving to changes in tax policy: tax price elasticities of -0.5, -1 and a series of income-based elasticities.1 To evaluate the impact on the total number of donors we use an elasticity of -0.8 evaluated at an average of the first-dollar tax price of giving and the traditional next-dollar tax price of giving.2
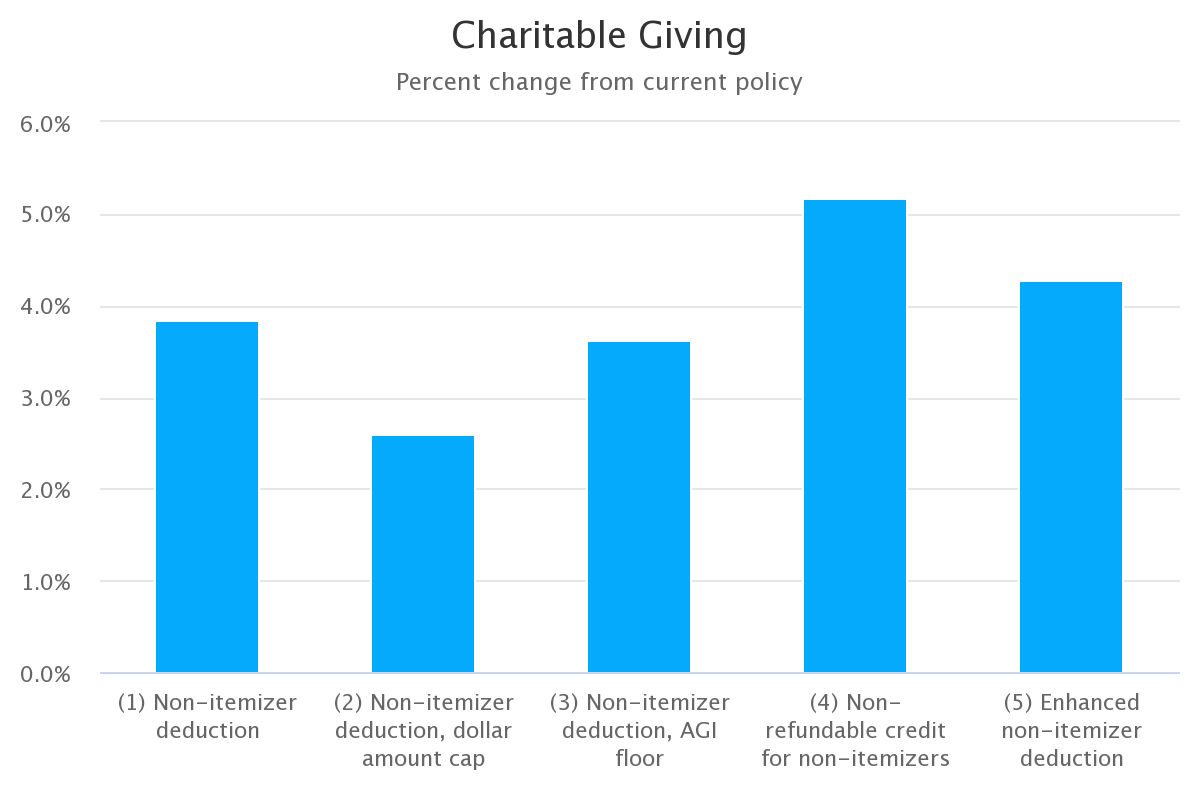
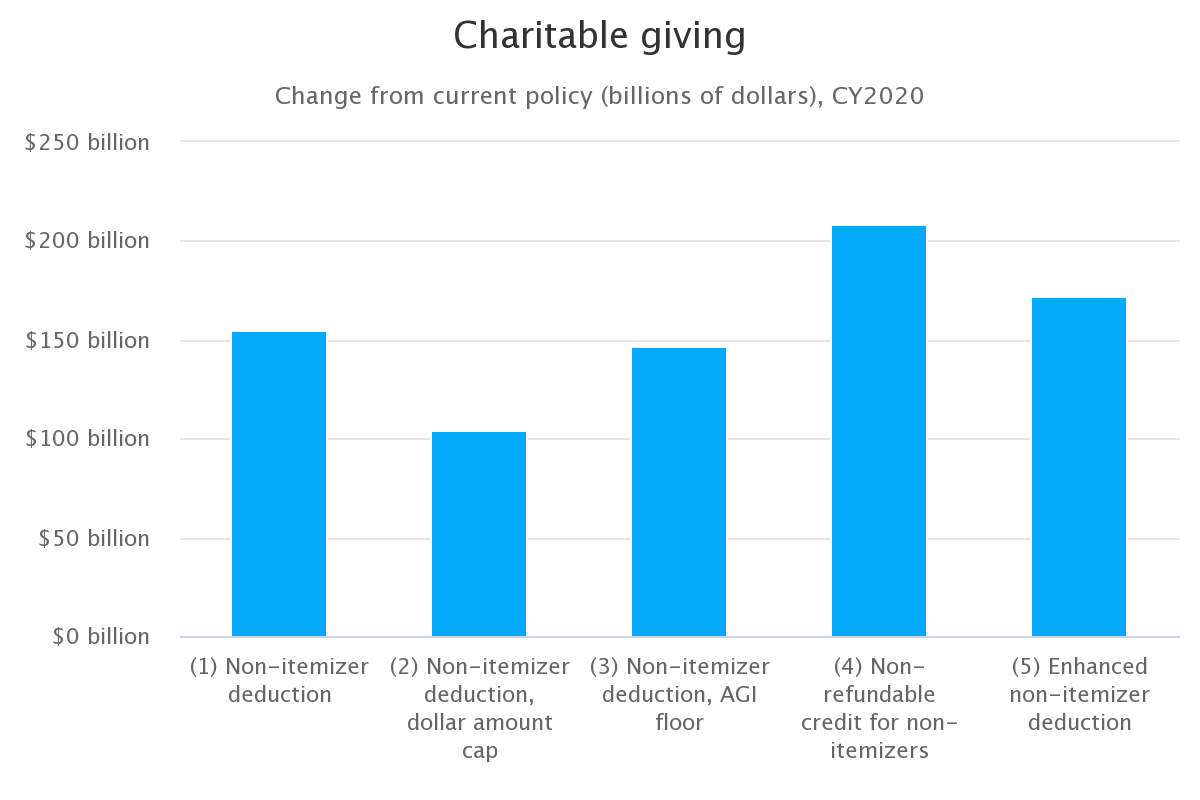
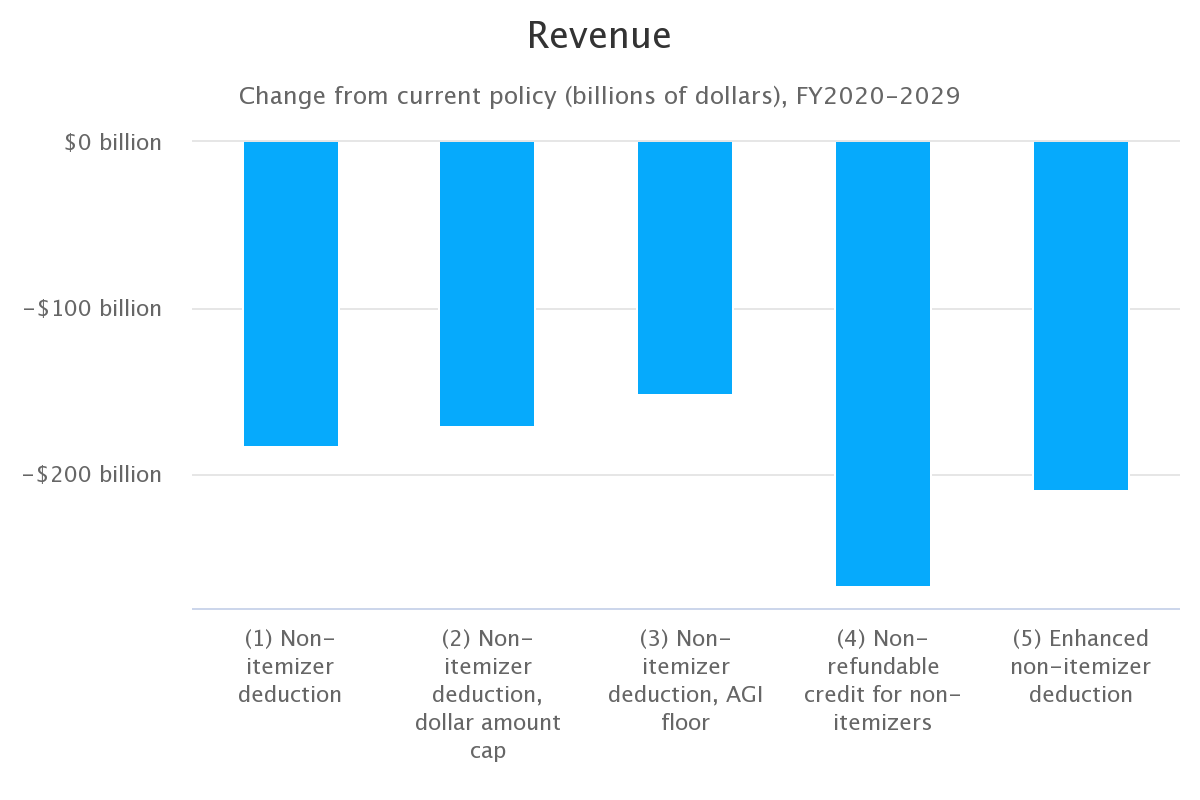
Below, we present interactive visualizations that show the results. (For a complete discussion of the policies and their potential effects, please refer to the Lilly Family School’s report.) Figure 1 presents how each policy is projected to change total charitable giving and revenues. Use the drop-down to toggle between metrics. The policies examined in this blog all increase charitable giving at the expense of tax revenue. Note that policies that provide larger incentives for charitable giving cost more, but they also boost charitable giving more.
Metric

Source: Penn Wharton Budget Model. Projections made using the Wharton Integrated Tax Simulator.
Notes: Policies take effect in 2020. Years are calendar year concept for the charitable giving projections and fiscal year concept for the revenue projections. Tax price elasticities used: "low" = -0.5; "high" -1.0; "income-based" = -2.236 for tax units under $50K in 2017 AGI, -1.49 under $100K, and -1.182 over $100K. High tax price elasticity shown on Figure 1. Projections using other elasticities can be found in the data file. Due to rounding, numbers presented throughout this document may not add up precisely to the totals provided and percentages may not precisely reflect the absolute figures.
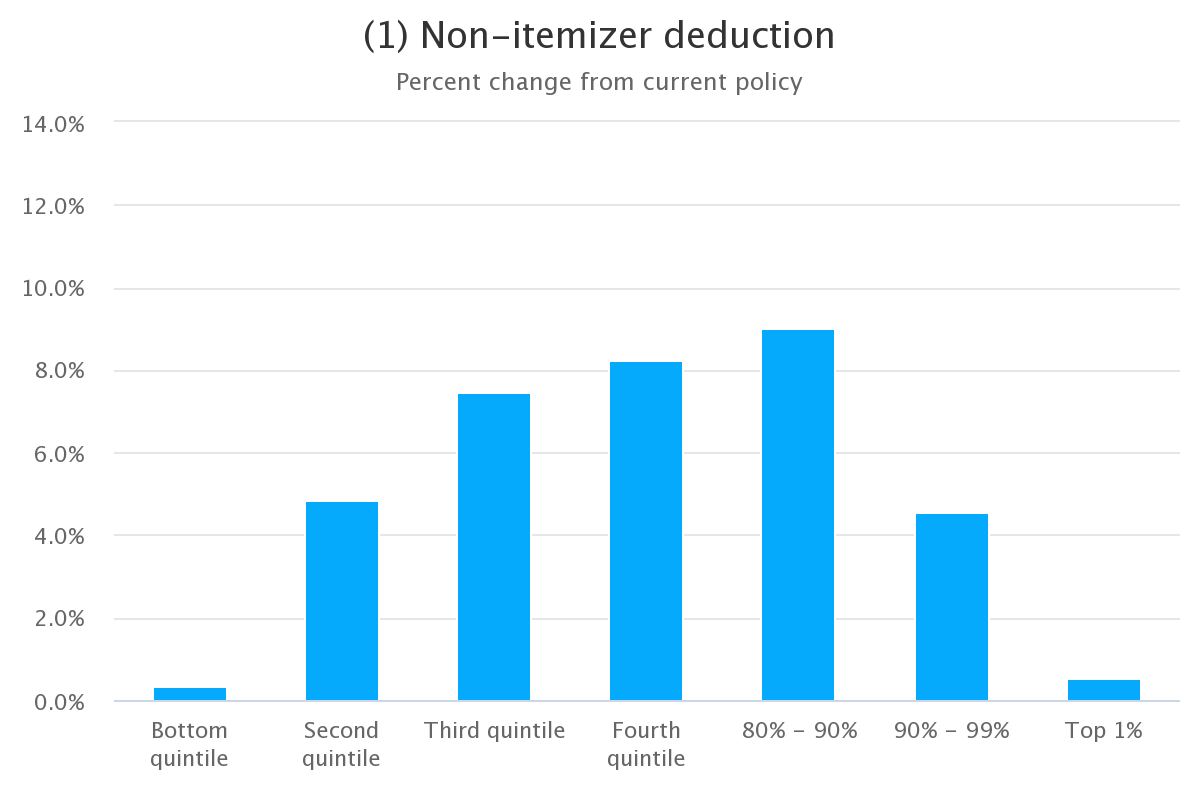
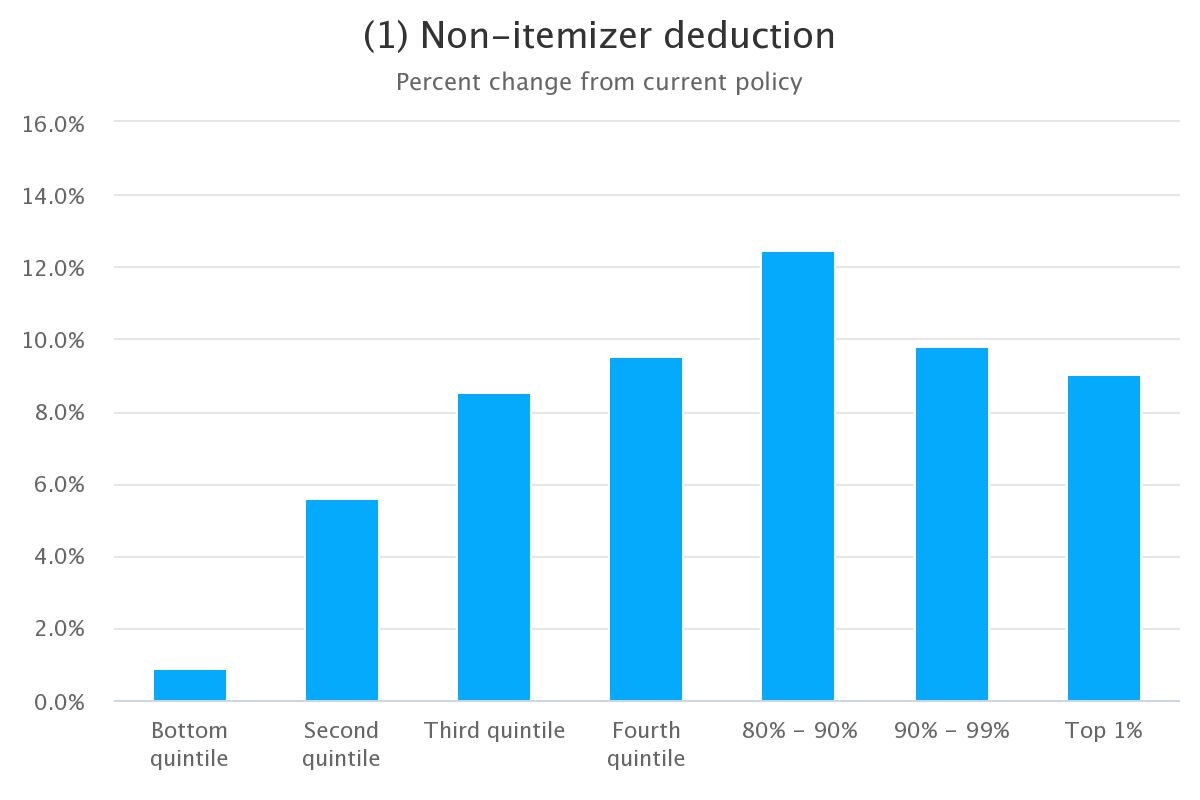
Figure 2 presents PWBM’s estimated impacts on the percent change to total charitable giving by income group from 2020 through 2029. Similarly, Figure 3 shows the percent change to number of donors rather than amount of giving in those same years. The drop-down menu controls which policy is displayed. Press the play button to see the impact of the policy change selected in each year.
Metric
Projections in 2020 shown below. To view additional years please view online*
Source: Penn Wharton Budget Model. Projections made using the Wharton Integrated Tax Simulator.
Notes: Policy takes effect in 2020. Years are calendar year concept. AGI percentiles are calculated exlcusive of filers with negative AGI. Tax price elasticities used: "low" = -0.5; "high" -1.0; "income-based" = -2.236 for tax units under $50K in 2017 AGI, -1.49 under $100K, and -1.182 over $100K. High tax price elasticity shown on Figure 2. Projections using other elasticities can be found in the data file. Due to rounding, numbers presented throughout this document may not add up precisely to the totals provided and percentages may not precisely reflect the absolute figures.
Metric
Projections in 2020 shown below. To view additional years please view online*
Source: Penn Wharton Budget Model. Projections made using the Wharton Integrated Tax Simulator.
Notes: Policies take effect in 2020. Years are calendar year concept. AGI percentiles are calculated exlcusive of filers with negative AGI. We use a -0.8 price elasticity, where price is an average of the first-dollar tax price (e.g. going from $0 of donations to $1) and next-dollar tax price (e.g. adding an additional dollar of donations to each tax return). Due to rounding, numbers presented throughout this document may not add up precisely to the totals provided and percentages may not precisely reflect the absolute figures.
By design, the effects of the policies to expand tax benefits for charitable contributions vary by income group. In particular, policies (1) and (2) are more beneficial for households with higher incomes. In contrast, policies (4) and (5) are designed to provide incentives for charitable giving for households with modest incomes.
The effects of the policy change selected vary from year to year because most of the individual income tax provisions of the 2017 tax law sunset at the end of 2025. When those provisions expire, the tax incentives for charitable giving return to pre-TCJA levels, particularly for households with higher incomes. Thus, the effects of the policies we examine in this blog are smaller starting in 2026.
-
The results presented in this blog reflect PWBM’s preferred elasticity of -1, which is the midpoint of the three elasticities used in the report. ↩
-
lmunia, Miguel & Lockwood, Ben & Scharf, Kimberley, 2017. "More Giving or More Givers? The Effects of Tax Incentives on Charitable Donations in the UK," CEPR Discussion Papers 12191. Available at https://warwick.ac.uk/fac/soc/economics/staff/blockwood/giving-givers-130717.pdf. This paper is the only research that disaggregates responses into intensive and extensive margins to our knowledge. Incorporating first-dollar tax prices helps measure the decision to donate at all, rather than only including next-dollar tax prices, which measures the price of donating another dollar. ↩