By Austin Herrick
Internal migration of working-age people in the United States has fallen by more than a third – from 18.86 percent in 1994 to 11.44 percent in 2018 (see Figure 1). This phenomenon has received significant scholarly attention – Cooke (2013)1 for example, attributes this decline to the rise of information and communication technologies. Alternatively, Molloy, Smith, and Wozniak (2011)2 point to broad macroeconomic shifts.
Reduced internal migration has important economic implications, particularly for labor markets. We find that wages grow faster for movers, especially for those with a college degree.
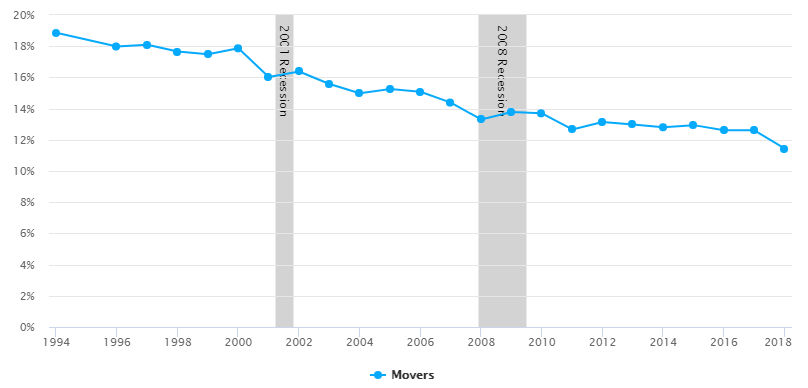
Source: Current Population Survey (1994 – 2018)
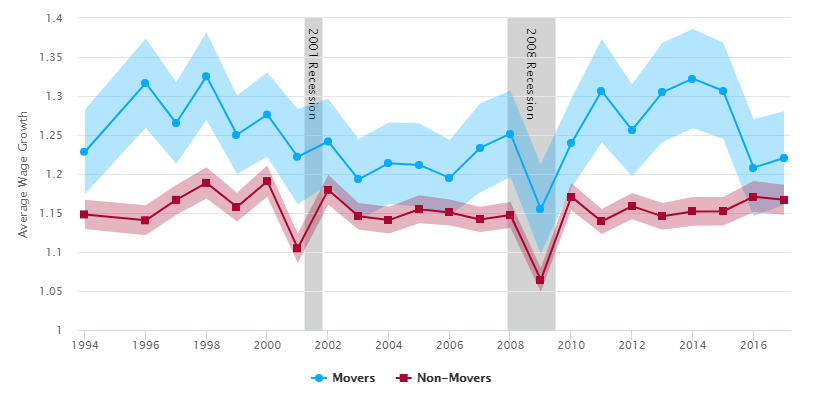
Figure 2 below shows observed wage growth for movers and non-movers over the last twenty years. As seen by the difference between the red and blue solid lines, the wage premium3 for moving over the last two decades has remained relatively constant, despite recessions (shaded gray) during the intervening years. The wage premium for moving suggests that migration improves matching between employers and employees.
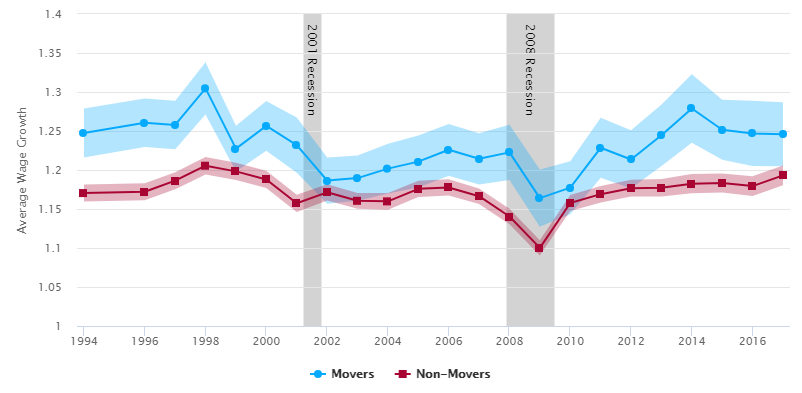
Note: The shaded blue and red ares represent 95 percent confidence intervals.
Source: Current Population Survey (1994 – 2018)
We might expect declines in migration to be correlated with changes in the labor market. As labor markets weaken, the wage premium for movers may decrease. Firms may be less willing to pay a premium to attract new workers in an economy where many current workers are being laid off.
The available data has some limitations. We only observe movement behavior of individuals who make the decision to move, which fewer people did in the wake of the financial crises in 2001 and 2008. It is possible that the wage premium for moving for all workers has decreased over time, even as the marginal wage premium for moving has remained steady. That is, given fixed costs of moving, workers offered lower wage premiums for moving decided against movement altogether, biasing upward the average wage premium for moving. The premium’s increase in recent years indicates labor markets seeking new talent in a population of households still wary about movement.
This suggested pattern of firms searching for new movers becomes more plausible when examining movement patterns of adults based on educational attainment. In Figure 3, we see that the movement rate for college-educated adults fell significantly faster than their non-college educated peers beginning in the early 2000s. Interestingly, this decline stabilizes around 2011.
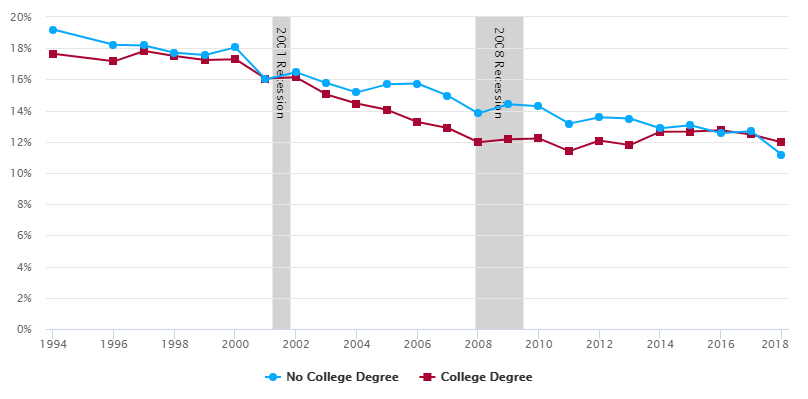
Source: Current Population Survey (1994 – 2018)
Further evidence of education’s effect on movement is shown in Figures 4 and 5, which display the wage premium of movers, conditioned on college degree attainment. From Figure 4, we see that the movement premium for non-college educated workers is often not statistically significantly above 0. Companies seem relatively unwilling to offer these less-educated workers a significant premium to induce movement, largely independent of economic conditions.
Note: The shaded blue and red ares represent 95 percent confidence intervals.
Source: Current Population Survey (1994 – 2018)
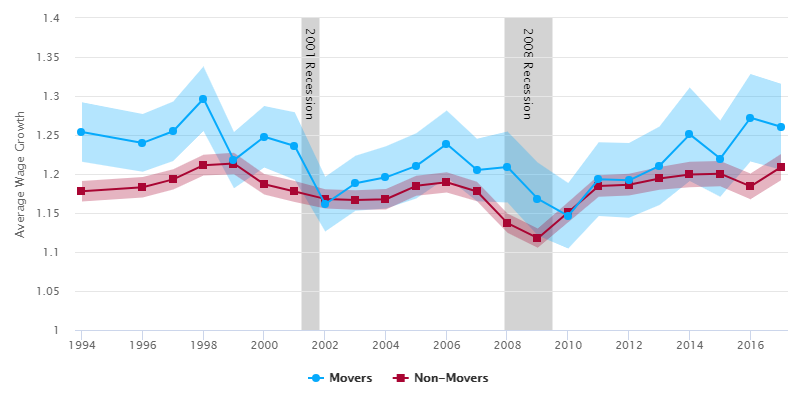
By contrast, in Figure 5, we see a highly significant wage premium for moving offered to college-educated workers. The data seems to reflect that college-educated workers are the primary recipients of the observed wage premium for movers.
This conclusion matches the results found by Gould (2007).4 In that study, Gould finds that higher urban wages are primarily driven by white-collar workers (a rough proxy for college education). Critically, the leveling-off of the college educated movement rate observed around 2011 maps onto the significant increase in the wage premium for moving observed for these workers in Figure 5. This observation supports the conclusion that wage premiums are successful in inducing movement.
Note: The shaded blue and red ares represent 95 percent confidence intervals.
Source: Current Population Survey (1994 – 2018)
We’ve identified that the wage premium for moving influences the decision to move. However, declining premiums only explain some of the puzzle - increasing premiums only stabilize, rather than reverse, internal migration rates, and movement has fallen dramatically over the past two decades. This suggests significant non-labor market factors affecting movement for American workers. We know the decision to move is influenced by the cost of moving and housing, among other things. A forthcoming post will explore the reasons why people report that they move.
-
Cooke, T. J. (2013). Internal Migration in Decline, The Professional Geographer, 65(4), 664-675. doi:10.1080/00330124.2012.724343 ↩
-
Molloy, R., Smith, C. L., & Wozniak, A. (2011). Internal Migration in the United States, Journal of Economic Perspectives, 25(3), 173-96. ↩
-
The wage premium measures the ratio of wage increases for individuals who moved compared to non-movers. For example, if the average non-mover received a 2 percent raise, compared to a 3 percent raise for movers, the wage premium is 50 percent. ↩
-
Gould, E. D. (2007). Cities, Workers, and Wages: A Structural Analysis of the Urban Wage Premium, The Review of Economic Studies, 74(2), 477–506. doi:10.1111/j.1467-937X.2007.00428.x ↩
  Value,Movers,StandardError
  1994,18.860913,0.001304
  1996,17.981096,0.001375
  1997,18.09522,0.001368
  1998,17.65817,0.001354
  1999,17.486219,0.001343
  2000,17.864216,0.001343
  2001,16.023391,0.001019
  2002,16.378894,0.001029
  2003,15.574425,0.001008
  2004,14.979454,0.000998
  2005,15.25065,0.001013
  2006,15.07861,0.001011
  2007,14.386101,0.000995
  2008,13.302812,0.000962
  2009,13.777376,0.000972
  2010,13.695174,0.000964
  2011,12.661716,0.000941
  2012,13.142633,0.000966
  2013,12.98464,0.000961
  2014,12.803088,0.000964
  2015,12.940293,0.000971
  2016,12.613803,0.000997
  2017,12.608216,0.000997
  2018,11.439719,0.000974
  Value,Movers,StandardError,Non-Movers,StandardError
  1994,1.247495,0.016035,1.170402,0.005542
  1996,1.26065,0.015858,1.172045,0.005603
  1997,1.257741,0.015848,1.186335,0.005552
  1998,1.3047,0.017126,1.205488,0.005668
  1999,1.227436,0.015016,1.198246,0.005688
  2000,1.256591,0.016263,1.187875,0.005621
  2001,1.231814,0.018098,1.157326,0.005665
  2002,1.186505,0.015139,1.171365,0.005269
  2003,1.18962,0.014831,1.160491,0.005176
  2004,1.201743,0.01623,1.159778,0.005399
  2005,1.210759,0.017004,1.175856,0.005332
  2006,1.225942,0.016924,1.177659,0.005276
  2007,1.214335,0.016724,1.166409,0.005096
  2008,1.222592,0.018108,1.140365,0.005089
  2009,1.163884,0.018701,1.100223,0.004951
  2010,1.177334,0.017306,1.157686,0.005289
  2011,1.228495,0.019639,1.16902,0.005381
  2012,1.213471,0.019047,1.176732,0.005478
  2013,1.244533,0.020161,1.17721,0.005727
  2014,1.278861,0.022376,1.182468,0.006285
  2015,1.251548,0.019592,1.183309,0.006243
  2016,1.246865,0.021362,1.179344,0.0065
  2017,1.245718,0.020933,1.193169,0.006493
  Value,No College Degree,StandardError,College Degree,StandardError
  1994,19.197801,0.001483,17.651563,0.002732
  1996,18.226941,0.001571,17.158485,0.002841
  1997,18.178303,0.001559,17.81851,0.002849
  1998,17.708835,0.001548,17.494488,0.002793
  1999,17.564441,0.001542,17.242727,0.002735
  2000,18.050993,0.001546,17.294799,0.002716
  2001,16.013412,0.001176,16.052715,0.00204
  2002,16.46367,0.001195,16.134575,0.002026
  2003,15.764783,0.001175,15.037159,0.00196
  2004,15.169847,0.001166,14.450081,0.001929
  2005,15.681302,0.001193,14.050111,0.001912
  2006,15.735138,0.001199,13.272455,0.001865
  2007,14.955941,0.001186,12.885191,0.001819
  2008,13.822156,0.001151,11.978495,0.001741
  2009,14.411261,0.001169,12.157264,0.001736
  2010,14.277546,0.001156,12.215951,0.001736
  2011,13.166185,0.001133,11.404628,0.00168
  2012,13.576897,0.001165,12.081713,0.001722
  2013,13.491182,0.001166,11.787578,0.00169
  2014,12.868659,0.001156,12.650868,0.001746
  2015,13.066364,0.001167,12.653443,0.00175
  2016,12.557117,0.001195,12.738154,0.001809
  2017,12.673547,0.001206,12.468703,0.001772
  2018,11.17868,0.001171,11.969263,0.001752
  Value,Movers,StandardError,Non-Movers,StandardError
  1994,1.253834,0.019427,1.177749,0.006713
  1996,1.239843,0.018857,1.182977,0.006746
  1997,1.254741,0.019438,1.193117,0.006695
  1998,1.296529,0.021148,1.211375,0.006786
  1999,1.217764,0.018452,1.213427,0.007005
  2000,1.247774,0.020068,1.186785,0.00671
  2001,1.235923,0.022139,1.177596,0.006926
  2002,1.161341,0.017927,1.168079,0.006246
  2003,1.188094,0.01795,1.166584,0.0064
  2004,1.195718,0.020412,1.167584,0.006754
  2005,1.210386,0.021383,1.184845,0.006551
  2006,1.238538,0.021908,1.189329,0.006654
  2007,1.205087,0.020417,1.177595,0.006408
  2008,1.208936,0.023265,1.137078,0.00634
  2009,1.168033,0.0239,1.117678,0.006307
  2010,1.146471,0.021458,1.151063,0.006643
  2011,1.193423,0.024071,1.184501,0.007009
  2012,1.191912,0.024475,1.186343,0.007081
  2013,1.210524,0.025662,1.194348,0.007481
  2014,1.250835,0.030568,1.199435,0.008345
  2015,1.219794,0.024938,1.200393,0.008242
  2016,1.272122,0.028625,1.184169,0.00838
  2017,1.260586,0.028073,1.208867,0.008574
  Value,Movers,StandardError,Non-Movers,StandardError
  1994,1.228554,0.027638,1.148219,0.009518
  1996,1.316511,0.029156,1.140625,0.009818
  1997,1.26534,0.026775,1.166892,0.009743
  1998,1.325323,0.028698,1.188617,0.010188
  1999,1.250309,0.025628,1.157595,0.009452
  2000,1.276157,0.027601,1.190844,0.010249
  2001,1.222138,0.031195,1.104865,0.009633
  2002,1.24169,0.027941,1.179674,0.009816
  2003,1.193132,0.026362,1.145974,0.008672
  2004,1.213804,0.026622,1.140915,0.008791
  2005,1.21167,0.027175,1.15486,0.009105
  2006,1.195057,0.024828,1.150662,0.008444
  2007,1.233377,0.029148,1.141698,0.008258
  2008,1.251646,0.028301,1.147409,0.008507
  2009,1.155006,0.029246,1.064293,0.007808
  2010,1.239162,0.029182,1.171014,0.008724
  2011,1.30665,0.033848,1.139119,0.008189
  2012,1.256258,0.030063,1.158842,0.008559
  2013,1.304719,0.032466,1.145737,0.008737
  2014,1.322299,0.032442,1.151953,0.009393
  2015,1.306671,0.031608,1.152218,0.009316
  2016,1.208228,0.031711,1.170972,0.010243
  2017,1.220534,0.030614,1.166938,0.009826