Measuring Openness
Previously, we examined the relationship between tariffs and the effective openness of the U.S. economy to foreign investment flows. We defined effective openness with a formula of capital flows and size of the U.S. economy:
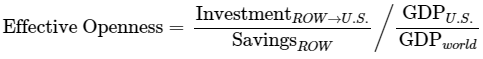
We estimated an empirical correlation between tariff rates and this measure of openness—using this model, we predicted that continued tariff rates of about 3.27 percent would imply an effective openness of 21 percent in 2019. According to the U.S. International Trade Commission, the actual average tariff rate over all imports (calculated as duties collected as a share of the total value of imports) was 2.80 percent in 2019.1 Because the average tariff rate was lower than expected, the empirically estimated relationship would imply a higher openness of 23.74 percent in 2019. Using newly available 2019 world and U.S. gross domestic product (GDP) data from the World Bank2 and 2019 financial inflow data from the Bureau of Economic Analysis,3 effective openness for 2019 is measured to be 18.21 percent—lower, but in line with, the prediction of the correlation model.
Financial flows can be fairly volatile from year to year. Therefore, to generate the openness rate used in PWBM’s dynamic model, we smooth the empirical series by averaging across a lagged 15-year window. The last available point in the smoothed series indicates an effective openness of 31.5 percent.

Recent data on foreign purchases of U.S. government debt also point to a lower level of openness. We update our previous measure of the foreign take up rate for new issuances of U.S. Treasury debt using the most recent data on foreign investors’ portfolio holdings of U.S. securities4 and total debt5 provided by the U.S. Department of the Treasury.6
To parameterize foreigners’ portfolio purchases of U.S. Treasury debt in our dynamic model, we calculate the lagged 15-year cumulative foreign take up rate.7 This smoothed series indicates a foreign take up rate of 33.34 percent for new issues of U.S. Treasury debt in 2019.

Foreign Financial Flows and U.S. Capital
It is unclear what frictions reduce the rate of dispersion of capital across the world expected by a ‘rational’ model. As explained in our previous posts, our model of openness frictions for equity flows assumes that: (1) there is a world rate of return and that foreign equity flows for a country with a totally (100 percent) open economy would be such to establish that rate in the country and (2) an openness rate of less than 100 percent therefore implies a proportional reduction of those flows. A consequence of this modeling approach is that an economy with lower openness but a larger deviation from the world rate may show larger foreign equity flows than a more open economy with a smaller deviation, as foreigners seeing a big opportunity for returns would want to invest more even in the face of higher impediments.
In the long run, reduced openness results in lower U.S. capital from two effects: (1) the reduction in foreign capital inflows and (2) the reduction of foreign purchases of U.S. Treasury debt, which shifts domestic savings toward holding more U.S. Treasury debt and less private capital—i.e., capital is crowded out. Foreigners’ motivations for owning U.S. Treasury debt versus more risky private capital may create differences in flows into the two asset classes, but we previously found empirically that the two rates tended to be comparable.
The Federal Reserve, the central bank of the U.S., has been purchasing large amounts of U.S. Treasury debt and certain other securities such as corporate bonds—which can be considered investments in private capital. According to its recently published balance sheet, as of September 10, 2020 the Federal Reserve had increased its holdings of Treasury securities to $4.39 trillion, holdings of mortgage-backed securities to $1.95 trillion, and holdings of commercial and private facilities to $119.97 billion.8 These purchases offset lower rates of asset acquisition by foreigners. Our model does not explicitly account for central bank asset purchases and the resulting effect on interest rates. If the Federal Reserve monetizes the debt by keeping debt assets on its balance sheet indefinitely,9 that action would amount to a transfer of real wealth from the private economy to the government. If the Federal Reserve instead reduces its balance sheet in the near future, then future interest rates will rise and the long-run net effect may be comparable to a model without Fed intervention.
Updates to Openness Path
Since our updated measures indicate a lower rate of U.S. asset take up by foreign investors, PWBM is changing the openness parameters we use for our baseline projection. Empirical estimates for 2019 of 31.5 percent openness for private capital flows and of 33.3 percent for U.S. debt take-up may not be long run values given the higher level of openness in the last two decades. But, recent policy and mood in the U.S. seem to point to continued lower levels of global flows. Both the current administration’s higher tariff policies and presidential candidate Joe Biden’s “Buy American” plan indicate that recent declines in openness are unlikely to be reversed in the near future.
We therefore make the assumption that openness continues at current levels for the next four years and then slowly increases to 40 percent by 2030, in contrast to our previous baseline which assumed a constantly 40 percent open economy. Our updated dynamic model allows for multi-sector production and foreign direct investment by multinational corporations, and we apply openness only to portfolio flows.
Table 1 shows the macroeconomic effects of switching to the new baseline. We find no significant effect on U.S. capital in 2030 but a slight decrease by 0.1 percent in 2040 and 2050. Labor and output impacts are effectively zero. Macroeconomic responses are small because of the small decline in openness for a short period of time.
| Year | GDP | Capital stock | Hours worked | Average hourly wage |
|---|---|---|---|---|
| 2030 | 0.0% | 0.0% | 0.0% | 0.0% |
| 2040 | 0.0% | -0.1% | 0.0% | 0.0% |
| 2050 | 0.0% | -0.1% | 0.0% | 0.0% |
This analysis was conducted by Efraim Berkovich and Zheli He. Prepared for the website by Mariko Paulson.
-
Available at: https://www.usitc.gov/documents/dataweb/ave_table_1891_2018.pdf. ↩
-
The World Bank. GDP (Current U.S. dollars). Available at: https://data.worldbank.org/indicator/NY.GDP.MKTP.CD.The World Bank has not provided gross savings data for 2019: https://data.worldbank.org/indicator/NY.GNS.ICTR.ZS. However, the world and U.S. gross savings (% of GDP) have been very stable in recent years at 25% and 18.5%, respectively. We, therefore, assume these persisted in 2019. ↩
-
Bureau of Economic Analysis. Table 1.1 U.S. International Transactions. U.S. financial inflow (millions of dollars). Available at: https://apps.bea.gov/itable/itable.cfm?reqid=62&step=1. ↩
-
Available at: https://www.treasury.gov/resource-center/data-chart-center/tic/Pages/shlreports.aspx. The data reported are as of the end of June in each year. Therefore, changes in foreign holdings of the U.S. Treasury debt are calculated on a June-to-June basis instead of a calendar-year or fiscal-year basis. ↩
-
Available at: https://www.treasurydirect.gov/govt/reports/pd/pd_debttothepenny.htm. ↩
-
Data on foreign holdings of U.S. long-term and short-term Treasury debt are only available from 2003. ↩
-
We calculate the lagged 15-year cumulative foreign take up rate as the ratio of changes in foreign holdings of the U.S. Treasury debt and changes in total debt outstanding across a lagged 15-year window. ↩
-
The Federal Reserve’s H.4.1 statistical release, “Factors Affecting Reserve Balances of Depository Institutions and Conditional Statement of Federal Reserve Banks,” Table 5, “Consolidated Statement of Condition of All Federal Reserve Banks.” Available at: https://www.federalreserve.gov/releases/h41/current/h41.htm. The reported numbers are calculated based on the September 10, 2020 release. ↩
-
Technically, the Fed monetizes the debt if it collects any interest payments from the U.S. Treasury because it returns a large portion of those payments back to the U.S. Treasury. ↩
    Year,Effective Openness (%) ,Moving Average with 15-Year Lags
    1977,15.04,
    1978,16.38,
    1979,8.80,
    1980,12.57,
    1981,16.21,
    1982,19.73,
    1983,16.14,
    1984,19.16,
    1985,20.53,
    1986,28.61,
    1987,28.93,
    1988,24.89,
    1989,21.82,
    1990,14.85,
    1991,11.12,18.32
    1992,15.28,18.33
    1993,22.47,18.74
    1994,22.99,19.69
    1995,31.00,20.92
    1996,35.89,22.23
    1997,44.01,23.85
    1998,27.14,24.58
    1999,44.03,26.24
    2000,55.96,28.60
    2001,41.56,29.46
    2002,41.67,30.31
    2003,42.07,31.46
    2004,64.99,34.34
    2005,47.59,36.52
    2006,71.32,40.53
    2007,68.28,44.07
    2008,14.24,43.52
    2009,11.29,42.74
    2010,44.05,43.61
    2011,29.42,43.18
    2012,18.50,41.48
    2013,30.29,41.69
    2014,30.54,40.79
    2015,13.67,37.97
    2016,18.89,36.45
    2017,38.48,36.24
    2018,17.80,34.62
    2019,18.21,31.50
    Year,Foreign Take-Up Rate (%) ,Moving Average with 15-Year Lags
    2003,45.07,
    2004,59.24,
    2005,24.80,
    2006,16.75,
    2007,47.78,
    2008,63.30,
    2009,42.70,
    2010,37.37,
    2011,54.57,
    2012,39.83,
    2013,32.32,
    2014,46.96,
    2015,25.37,
    2016,9.80,38.68
    2017,-26.40,36.13
    2018,4.11,32.02
    2019,49.67,33.34