Introduction
International capital flows into the U.S. economy are linked to the amount of international trade. American household net purchases of imports return to the U.S. as foreign purchases of U.S. assets. We measure the historical effect of tariffs on financial flows into the U.S. and use this estimated relationship to examine the effect of various trade policy scenarios using Penn Wharton Budget Model’s dynamic model.
Measuring Effective Openness to International Investment Flows
The concept of “effective openness” to international capital flows is distinct from the laws that directly regulate (control) the flow of capital into and out of a country. Capital controls include residency-based measures that limit or prohibit the flow of capital. However, even a country with relatively few laws that directly limit the flow of capital may not be fully effectively open due to various non-legal frictions on capital flows, including a preference to invest in one’s own country (the “home bias” puzzle1). We previously noted that the amount of foreign investment inflows depends on the willingness of foreign savers to purchase dollar-denominated assets. Additionally, we reviewed the real-world evidence for a strong and persistent home bias that motivates investors to reduce exposure to foreign assets despite higher expected yields.
In this study, we use gross savings and gross domestic product (GDP) data from the World Bank2 and financial inflow data from the Bureau of Economic Analysis3 to measure the effective openness of the U.S. economy to international capital flows. We measure the effective openness of the U.S. economy to foreign investment flows as the share of savings from the rest of the world that are invested into the U.S. normalized by the U.S. share of world GDP.4
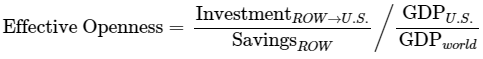
Notes: ROW: Rest of World (not including the U.S.), world: All countries (including the U.S.), ROW -> U.S.: Rest of World investment in U.S.
In a closed economy, this measure equals zero since no foreign investment enters the United States. In a fully open economy, this measure equals one since the U.S. receives as much investment from foreigners as the U.S.’s share of world GDP. Figure 1 shows this measure historically. From 2001 to 2017, we find that the average rate is 0.37. The long-run trend, however, has been toward increased openness.
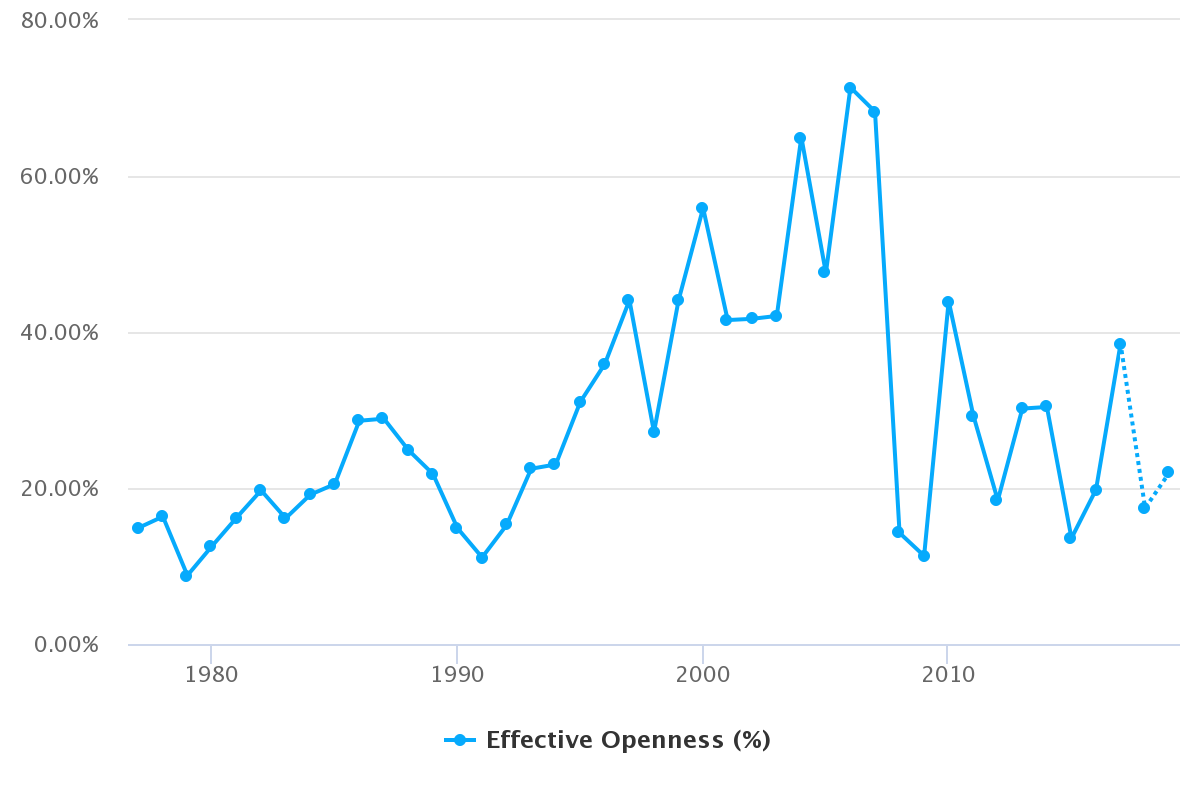
Notes: The dotted line represents our preliminary projection for years 2018 and 2019 based on our projections of gross savings, GDP and financial inflows into the U.S.; these estimates will become formalized after the World Bank and the Bureau of Economic Analysis update their data.
Figure 2 shows historical data from the U.S. International Trade Commission5 for tariff rates on imports. We show the average tariff rate over all imports, which is calculated as duties collected as a share of the total value of imports. We note that individual goods and countries face a variety of tariff rates which are accounted for in the average. Over the past century, U.S. tariff rates on imports have trended down. While tariffs have fallen sharply over time, we estimate that recent tariff levels have come back to levels last seen in the 1980s.
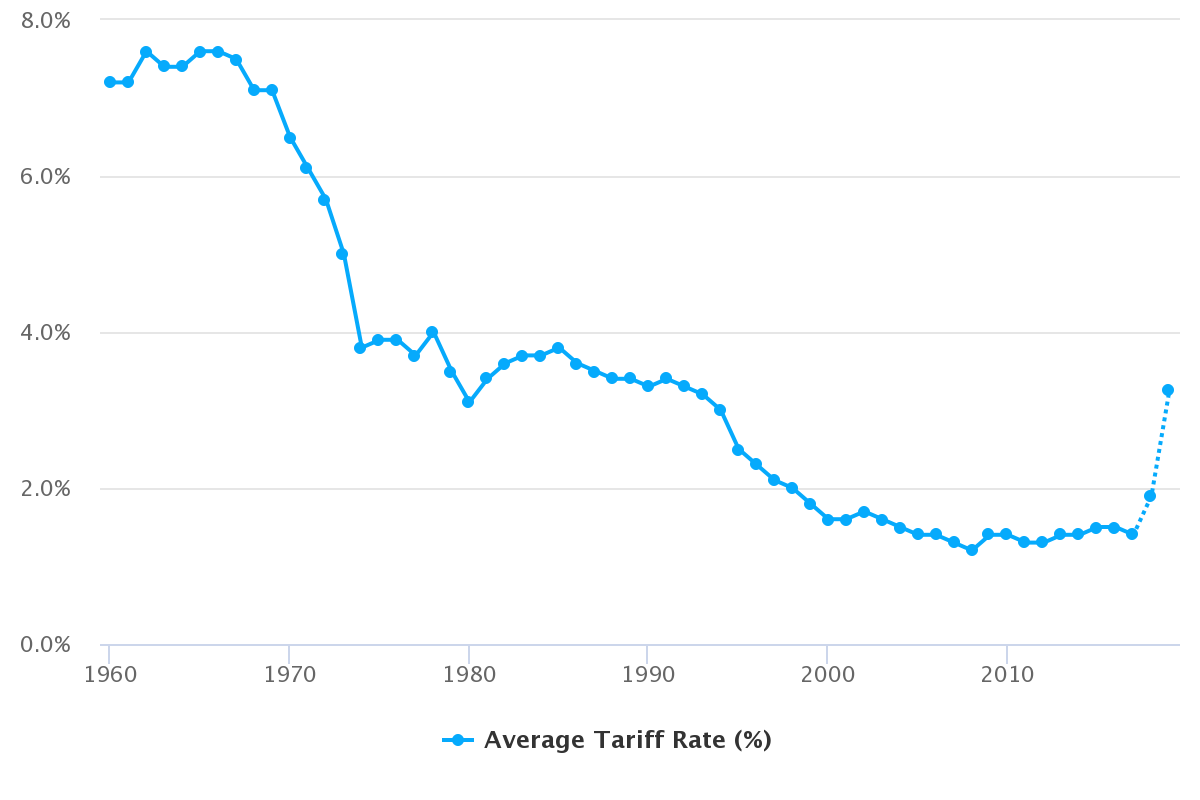
Notes: 1960-2017 from Office of Analysis and Research Services, Office of Operations, U.S. International Trade Commission (March 2019). Available at https://www.usitc.gov/documents/dataweb/ave_table_1891_2018.pdf. The dotted line represents the preliminary 2018 tariff rate from the U.S. International Trade Commission and we use NBER working paper (Amiti, Mary, Stephen Redding and David Weinstein, (2019). "The Impact of The 2018 Trade War on U.S. Prices and Welfare," NBER Working Paper, 25672. Available at https://www.nber.org/papers/w25672), for 2019 tariff rate.
We estimate an empirical relationship between average tariff rates and the level of effective openness as follows:6
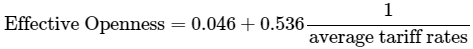
Not surprisingly, when tariff rates increase, effective openness is reduced. In balance of payments terms, the current account (trade of goods) must be offset by the financial account (trade of assets). U.S. households purchase imports from foreigners with dollars. Foreigners can use those dollars to purchase U.S. exports or, instead, to acquire dollar-denominated assets. Primarily, those assets consist of U.S. government debt or of U.S. physical capital (via purchases of equity, business debt, direct investment, and so on). The U.S. is a net importer, so foreigners are net investors into dollar-denominated assets rather than net buyers of U.S. exports. The ability of foreigners to invest in U.S. physical capital is directly related to their acquisition of dollars from trade. Thus, a decrease in U.S. imports resulting from higher tariffs reduces effective openness, all else equal.
The Concept of Openness to International Capital Flows in PWBM
PWBM previously examined empirical data to find that the foreign take-up rate of new government debt issuance is 40 percent.7 U.S. federal government debt securities (which broadly include dollars themselves as the shortest term security) hold a special place in the world because the U.S. dollar is the world’s reserve currency. Therefore, we expect foreigners to hold U.S. federal debt for reasons other than to allocate investment toward advantageous returns. Because foreigners have different reasons for holding U.S. federal debt and U.S. physical capital, there may also be a difference between foreigners’ take-up of U.S. federal debt and foreigners’ take-up of U.S. physical capital in the short-run.8 However, in the long-run, dollars to fund foreigners’ dollar-denominated asset purchases must come from trade imbalance. Consequently, all asset purchases must eventually decline if the U.S. ceases to be a net importer. We take the approach that tariffs reduce debt take-up by the same amount, which is consistent in the long-run and consistent with our modeling.9
PWBM implements a related definition of effective openness. We define openness as the additional investment needed for the U.S. after-tax return to capital to equal the world rate. The empirical measure of openness described above matches relatively closely with the model’s definition of effective openness.
The Impact of Trade War Scenarios
Over the course of 2018, the average tariff rate on imports increased from 1.52 percent to 3.27 percent according to a recent NBER working paper.10 Based on our estimates of the relationship between tariffs and openness, we set the openness of the U.S. to foreign investment to be 21 percent in 2019. We previously showed the impact of an all-out trade war. Here, we model five policy scenarios:
Small trade war, short: The U.S. economy is 21 percent open until 2021 and then reverts to the 21st century average of 37 percent.
Small trade war, long: Same as (1), except the reversion to 37 percent open begins in 2026.
Small trade war, permanent: The U.S. economy is 21 percent open indefinitely.
Big trade war, short: Average tariff rates are increased another 3 percentage points to 6.27 percent. The U.S. economy is 13 percent open in 2021 and then reverts to the 21st century average of 37 percent over the course of 3 years.
Big trade war, long: Same as (4), except the reversion to 37 percent open begins in 2026.
Notice that policy scenarios (1), (2) and (3) correspond to the current trade war, each lasting a different amount of time. Policy scenarios (4) and (5) correspond to a bigger trade war.11
Our projections reflect changes in the openness of the U.S. economy to foreign investment flows. We do not account for other effects of changes to trade policy, including adjustment costs from reallocating productive capital and labor and how trade can reduce the market power of domestic firms. Adding these factors would likely reinforce the key insight that even a temporary trade war can permanently lower GDP.
Figure 3 shows PWBM’s projection of key macroeconomic variables under each alternative trade war scenario relative to a scenario where openness remained at the 21st-century average of 37 percent from the year 2019 and onward. Use the drop-down menu to see the effect on GDP, effective labor input, and capital services.
Macroeconomic Variable
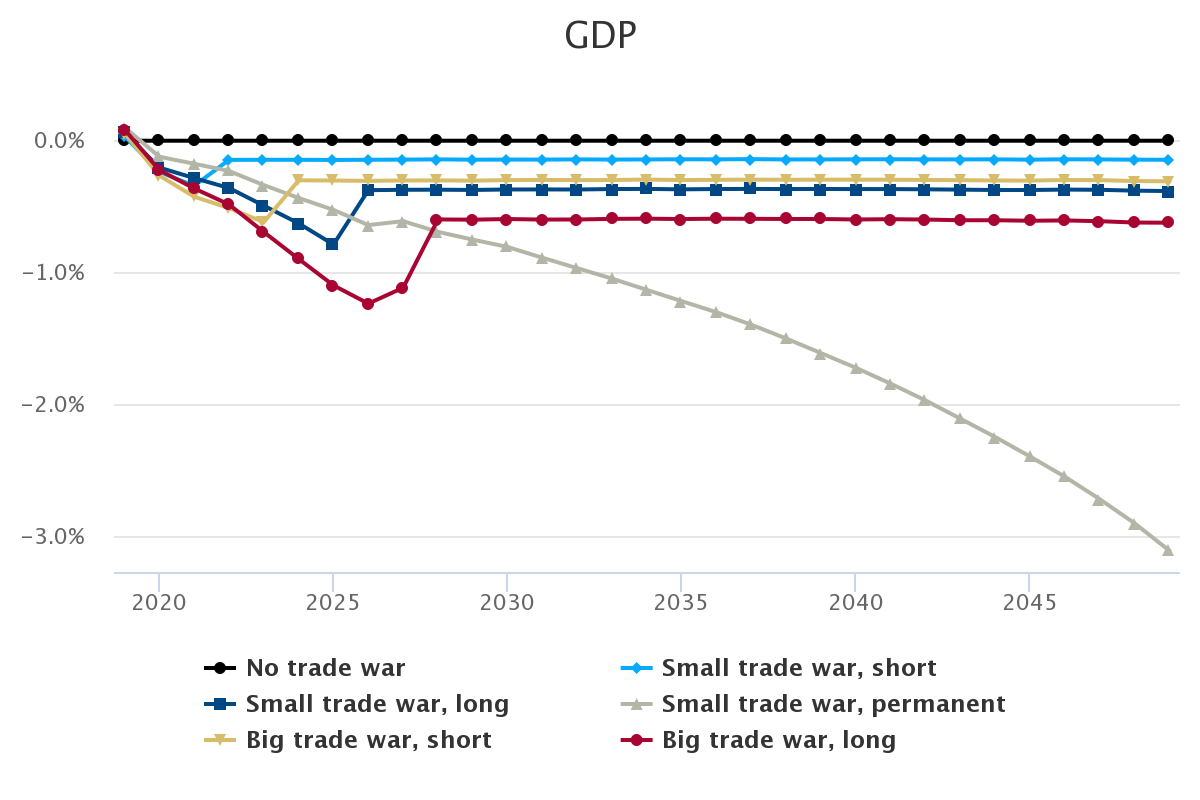
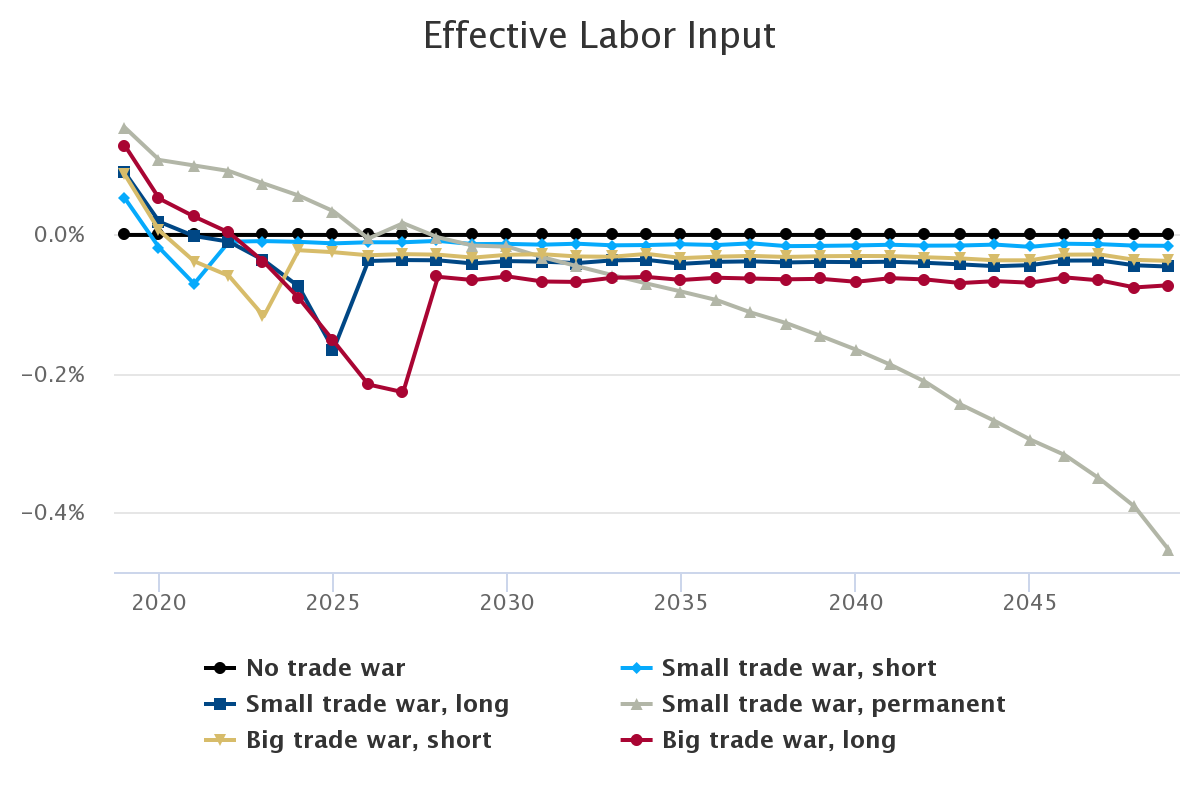
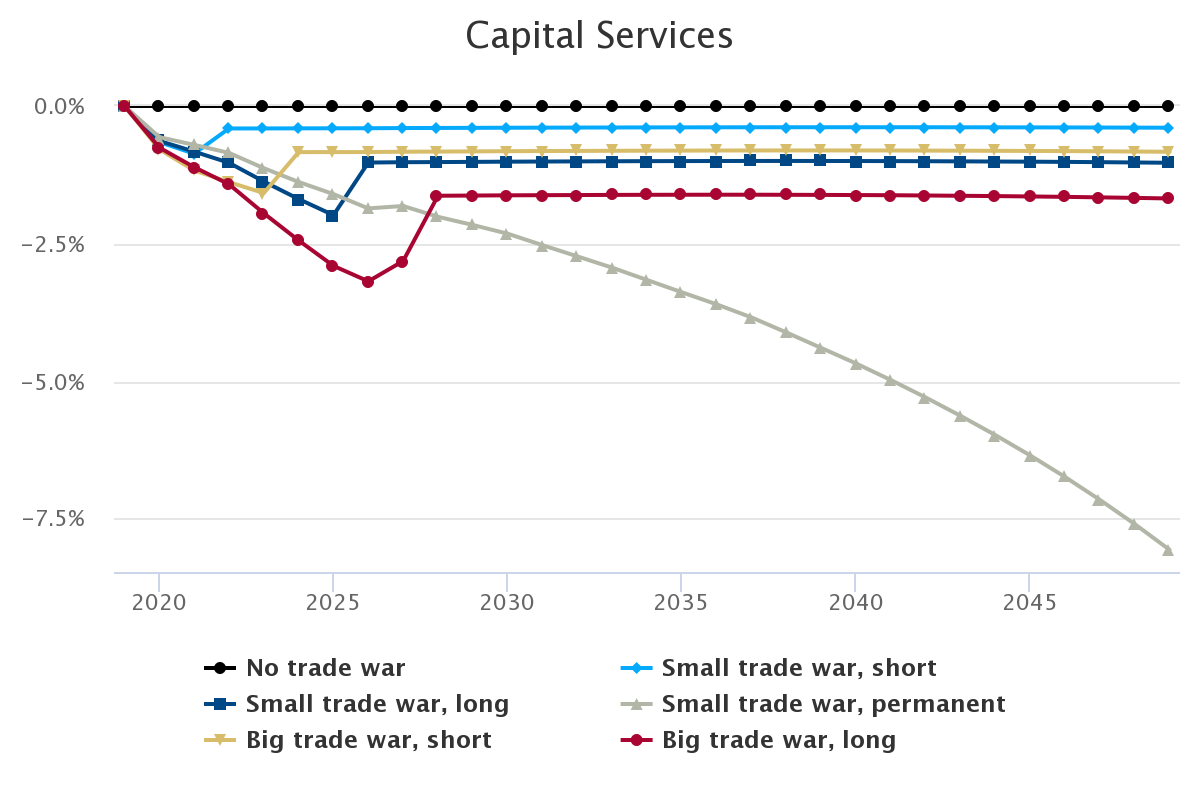
In the short-run, lower openness to foreign investment flows actually boosts GDP because U.S. households provide more labor supply, which, in part, ameliorates the consequences of lower domestic capital stock in the future. After 2019, the “no trade war” scenario has the highest GDP, but the U.S. has been in a trade war since 2018. Notice that extending the current trade war, that is, going from scenario (1) to scenario (2), actually improves GDP in 2020. In all trade wars, the consequence of a temporary decrease in openness, however, creates a permanently lower private capital stock. Even when previous openness is restored, the temporary drop in openness causes U.S. capital to be lower over the long-run and permanently reduces GDP.
-
Feldstein, M. and C. Horoika (1980), “Domestic Saving and International Capital Flows,” The Economic Journal, vol. 90, no. 358, pp. 314-329 and Obstfeld, M. and K. Rogoff (2000), “The Six Major Puzzles in International Macroeconomics: Is There a Common Cause?” Macroeconomics Annual 2000, National Bureau of Economic Research, vol. 15, pp. 339-412. ↩
-
The World Bank. Gross savings (percent of GDP). Available at: https://data.worldbank.org/indicator/NY.GNS.ICTR.ZS and The World Bank. GDP (Current U.S. dollars). Available at: https://data.worldbank.org/indicator/NY.GDP.MKTP.CD. ↩
-
Bureau of Economic Analysis. Table 1.1 U.S. International Transactions. U.S. financial inflow (millions of dollars). Available at: https://apps.bea.gov/itable/itable.cfm?reqid=62&step=1. ↩
-
We assume that the production function is similar across countries. ↩
-
https://www.usitc.gov/documents/dataweb/ave_table_1891_2018.pdf. ↩
-
Estimation uses all data points from 1977-2017 but excludes 2008-2009 financial crisis years as outliers (due to sharp reduction in investment into the U.S.). Our nonlinear regression model takes the form of 1/x with an R-squared measure of 0.4. ↩
-
Penn Wharton Budget Model. (2016). Setting Behavioral Responses in PWBM’S Dynamic Simulations. Available at: https://budgetmodel.wharton.upenn.edu/issues/2016/9/13/setting-behavioral-responses-in-pwbms-dynamic-simulations. ↩
-
We lack data to estimate the relationship between foreign take-up of U.S. federal debt and tariffs. ↩
-
PWBM’s Dynamic OLG assumes an economy with no aggregate risks. ↩
-
Amiti, Mary, Stephen Redding and David Weinstein, (2019). "The Impact of The 2018 Trade War on U.S. Prices and Welfare," NBER Working Paper, 25672. Available at: https://www.nber.org/papers/w25672. ↩
-
We assume that tax policy is held fixed at 2018 rates. In reality, numerous tax provisions under current law expire or phase-out in future years. This assumption avoids explaining interaction effects but does not change the key insights. ↩
    Year,Effective Openness (%)
    1977,14.88
    1978,16.34
    1979,8.79
    1980,12.55
    1981,16.19
    1982,19.70
    1983,16.12
    1984,19.14
    1985,20.50
    1986,28.62
    1987,28.89
    1988,24.86
    1989,21.79
    1990,14.84
    1991,11.10
    1992,15.26
    1993,22.47
    1994,23.02
    1995,31.04
    1996,35.92
    1997,44.07
    1998,27.17
    1999,44.06
    2000,55.89
    2001,41.53
    2002,41.69
    2003,42.06
    2004,64.98
    2005,47.57
    2006,71.36
    2007,68.24
    2008,14.24
    2009,11.30
    2010,43.96
    2011,29.35
    2012,18.42
    2013,30.18
    2014,30.39
    2015,13.56
    2016,19.79
    2017,38.49
    2018,17.42
    2019,22.04
    Year,Average Tariff Rate (%)
    1960,7.2
    1961,7.2
    1962,7.6
    1963,7.4
    1964,7.4
    1965,7.6
    1966,7.6
    1967,7.5
    1968,7.1
    1969,7.1
    1970,6.5
    1971,6.1
    1972,5.7
    1973,5.0
    1974,3.8
    1975,3.9
    1976,3.9
    1977,3.7
    1978,4.0
    1979,3.5
    1980,3.1
    1981,3.4
    1982,3.6
    1983,3.7
    1984,3.7
    1985,3.8
    1986,3.6
    1987,3.5
    1988,3.4
    1989,3.4
    1990,3.3
    1991,3.4
    1992,3.3
    1993,3.2
    1994,3.0
    1995,2.5
    1996,2.3
    1997,2.1
    1998,2.0
    1999,1.8
    2000,1.6
    2001,1.6
    2002,1.7
    2003,1.6
    2004,1.5
    2005,1.4
    2006,1.4
    2007,1.3
    2008,1.2
    2009,1.4
    2010,1.4
    2011,1.3
    2012,1.3
    2013,1.4
    2014,1.4
    2015,1.5
    2016,1.5
    2017,1.4
    2018,1.9
    2019,3.25
    Year,No trade war,Small trade war_short,Small trade war_long,Small trade war_permanent,Big trade war_short,Big trade war_long
    2019,0,0.0354842,0.060032,0.1026365,0.0580696,0.0856534
    2020,0,-0.2355382,-0.2035419,-0.121388,-0.2640986,-0.2232172
    2021,0,-0.3419298,-0.283343,-0.1745378,-0.4244238,-0.3615083
    2022,0,-0.145421,-0.3582917,-0.2296,-0.5110359,-0.4833589
    2023,0,-0.1446208,-0.4927129,-0.3367425,-0.6175513,-0.6924526
    2024,0,-0.1447062,-0.6266218,-0.4341747,-0.3001631,-0.8965049
    2025,0,-0.1458879,-0.7871383,-0.5245306,-0.3018516,-1.096963
    2026,0,-0.1444479,-0.3752098,-0.6397261,-0.3044547,-1.235412
    2027,0,-0.14334,-0.3721454,-0.6101294,-0.301347,-1.11496
    2028,0,-0.1413727,-0.3715391,-0.6912013,-0.3009737,-0.5969866
    2029,0,-0.1437776,-0.3733586,-0.7501872,-0.3026045,-0.5987184
    2030,0,-0.1429234,-0.3698269,-0.8058197,-0.2986768,-0.5938845
    2031,0,-0.1431459,-0.3694988,-0.8878363,-0.2972878,-0.5979378
    2032,0,-0.1416969,-0.3699362,-0.966791,-0.2986285,-0.5974696
    2033,0,-0.1427698,-0.3665384,-1.046154,-0.2980717,-0.5926597
    2034,0,-0.142022,-0.3654156,-1.131719,-0.2946518,-0.5913038
    2035,0,-0.1408521,-0.3687237,-1.216888,-0.2982195,-0.593834
    2036,0,-0.1413484,-0.3664027,-1.301305,-0.2963459,-0.5914201
    2037,0,-0.1395014,-0.3655786,-1.395829,-0.2952366,-0.5922068
    2038,0,-0.1420921,-0.3666436,-1.500672,-0.2961268,-0.5934069
    2039,0,-0.1418043,-0.3662233,-1.611304,-0.2953973,-0.5936093
    2040,0,-0.1413,-0.3667096,-1.7227,-0.2952666,-0.5973532
    2041,0,-0.1406748,-0.3668119,-1.842858,-0.2956577,-0.5949767
    2042,0,-0.1416406,-0.3685576,-1.970307,-0.2972886,-0.5977889
    2043,0,-0.1417013,-0.370983,-2.108567,-0.2990458,-0.6030677
    2044,0,-0.1411176,-0.37379,-2.247904,-0.3016902,-0.6031553
    2045,0,-0.1436153,-0.3737831,-2.39554,-0.3024022,-0.6069517
    2046,0,-0.1409325,-0.3707155,-2.54904,-0.2978952,-0.6044695
    2047,0,-0.1418623,-0.3722398,-2.719149,-0.299013,-0.610424
    2048,0,-0.1438625,-0.3787357,-2.901692,-0.3056218,-0.6204568
    2049,0,-0.144715,-0.3818533,-3.110079,-0.3081827,-0.6217956
    Year,No trade war,Small trade war_short,Small trade war_long,Small trade war_permanent,Big trade war_short,Big trade war_long
    2019,0,0.0537686,0.0909677,0.1555502,0.0880017,0.1298112
    2020,0,-0.0185969,0.0189902,0.108245,0.0063592,0.0524325
    2021,0,-0.0705533,-0.0015327,0.1002885,-0.0379191,0.0265976
    2022,0,-0.0097493,-0.0097063,0.0922923,-0.0590987,0.0034722
    2023,0,-0.00886,-0.036601,0.0742062,-0.1173098,-0.0388302
    2024,0,-0.0099441,-0.0743089,0.0568823,-0.0220221,-0.0907871
    2025,0,-0.0121606,-0.1655344,0.0342323,-0.0249163,-0.1528824
    2026,0,-0.010571,-0.0375895,-0.0051824,-0.0293348,-0.2158254
    2027,0,-0.0106166,-0.0362615,0.0169511,-0.0276973,-0.2269994
    2028,0,-0.0085552,-0.0365964,-0.0034383,-0.0284608,-0.0604142
    2029,0,-0.0131863,-0.0411911,-0.0153224,-0.0327272,-0.0650782
    2030,0,-0.0129275,-0.0377225,-0.0169278,-0.0286219,-0.0598773
    2031,0,-0.014036,-0.0385611,-0.0321552,-0.0278339,-0.0671957
    2032,0,-0.0126507,-0.0405598,-0.0451774,-0.0310947,-0.0678317
    2033,0,-0.0149618,-0.0367297,-0.0578783,-0.0314425,-0.0618616
    2034,0,-0.0145661,-0.0360043,-0.0702097,-0.0273397,-0.0606327
    2035,0,-0.0133533,-0.0416593,-0.0818735,-0.0334251,-0.0649683
    2036,0,-0.0145353,-0.0388755,-0.0939883,-0.0313528,-0.0617685
    2037,0,-0.0121228,-0.0381146,-0.1122242,-0.03025,-0.0629233
    2038,0,-0.0161282,-0.0397049,-0.1272354,-0.0317413,-0.0640479
    2039,0,-0.0158094,-0.0388627,-0.1459875,-0.0306837,-0.0633622
    2040,0,-0.0151599,-0.0392362,-0.1655953,-0.0303383,-0.0676501
    2041,0,-0.0141509,-0.0386693,-0.1875362,-0.0304944,-0.0623462
    2042,0,-0.0154605,-0.040212,-0.2123504,-0.0322135,-0.0642501
    2043,0,-0.0152558,-0.0424874,-0.244655,-0.0338519,-0.0694588
    2044,0,-0.0139541,-0.0451299,-0.2689534,-0.0366361,-0.0666527
    2045,0,-0.0171785,-0.0435753,-0.2952543,-0.036593,-0.0689287
    2046,0,-0.0126794,-0.0370201,-0.3178257,-0.0284606,-0.0613134
    2047,0,-0.0132919,-0.0368319,-0.3520887,-0.0281821,-0.0656016
    2048,0,-0.0154112,-0.043842,-0.392198,-0.0359439,-0.0757727
    2049,0,-0.0157111,-0.0456272,-0.4559475,-0.0375051,-0.0725655
    Year,No trade war,Small trade war_short,Small trade war_long,Small trade war_permanent,Big trade war_short,Big trade war_long
    2019,0,0,0,0,0,0
    2020,0,-0.6552938,-0.6340971,-0.5656394,-0.7870166,-0.7561299
    2021,0,-0.866635,-0.8281211,-0.7058799,-1.170455,-1.110616
    2022,0,-0.4082515,-1.031487,-0.8514976,-1.382485,-1.421599
    2023,0,-0.4076349,-1.372178,-1.129651,-1.581472,-1.949075
    2024,0,-0.4057817,-1.690055,-1.380527,-0.8378682,-2.442046
    2025,0,-0.4049575,-1.982745,-1.60028,-0.8372347,-2.904173
    2026,0,-0.4038071,-1.027325,-1.860014,-0.8363467,-3.184943
    2027,0,-0.4004684,-1.020922,-1.816202,-0.8304152,-2.816141
    2028,0,-0.3986809,-1.01853,-2.012814,-0.8278461,-1.630376
    2029,0,-0.3967927,-1.015026,-2.161326,-0.8244098,-1.626504
    2030,0,-0.394809,-1.011366,-2.319479,-0.8208251,-1.622372
    2031,0,-0.3932867,-1.008777,-2.528004,-0.8182582,-1.620164
    2032,0,-0.3917399,-1.006242,-2.731615,-0.8159371,-1.617593
    2033,0,-0.390382,-1.00363,-2.936746,-0.8136109,-1.615002
    2034,0,-0.3889686,-1.001775,-3.160212,-0.8115004,-1.613399
    2035,0,-0.3879071,-1.000571,-3.38347,-0.8102397,-1.612492
    2036,0,-0.3870344,-0.9991089,-3.603414,-0.8087188,-1.611543
    2037,0,-0.3863023,-0.998193,-3.840635,-0.8076078,-1.611658
    2038,0,-0.386151,-0.9982399,-4.113076,-0.8073484,-1.612986
    2039,0,-0.3859403,-0.9986293,-4.394657,-0.8072565,-1.614888
    2040,0,-0.3857218,-0.9993229,-4.676322,-0.8075277,-1.617591
    2041,0,-0.385822,-1.000702,-4.978145,-0.8083894,-1.620805
    2042,0,-0.3861181,-1.002868,-5.294876,-0.8098341,-1.625365
    2043,0,-0.3867007,-1.005572,-5.6279,-0.8118216,-1.63077
    2044,0,-0.3874981,-1.00869,-5.977991,-0.8141893,-1.636398
    2045,0,-0.3885952,-1.011684,-6.347111,-0.8163836,-1.643107
    2046,0,-0.3894094,-1.015285,-6.738663,-0.8188521,-1.650421
    2047,0,-0.3909641,-1.020124,-7.154707,-0.8226367,-1.659567
    2048,0,-0.3927478,-1.025636,-7.594015,-0.8270299,-1.669314
    2049,0,-0.3946607,-1.031307,-8.061894,-0.8315285,-1.679348