By Alexander Arnon
US production of crude oil has more than doubled since 2008.1 Starting in the mid-2000s, the application of horizontal drilling and hydraulic fracturing to tight oil formations led to a surge in US supply known as the shale boom. In this post, I discuss the shale boom’s impact on the relationship between business investment and the price of oil.2 I then estimate the effect of the recent rise in oil prices on investment in 2018. I find that oil prices might even account for most of the increase in the growth rate of investment in 2018.
Business Investment After the Shale Boom
Oil production is capital-intensive. As US production expanded rapidly over the last decade, the oil sector’s importance as a driver of business investment grew in tandem. Figure 1 shows the contribution of oil-related assets to growth in private nonresidential fixed investment. Oil’s direct impact on investment increased sharply around the beginning of the shale boom and has remained significant, though not always positive, since then.
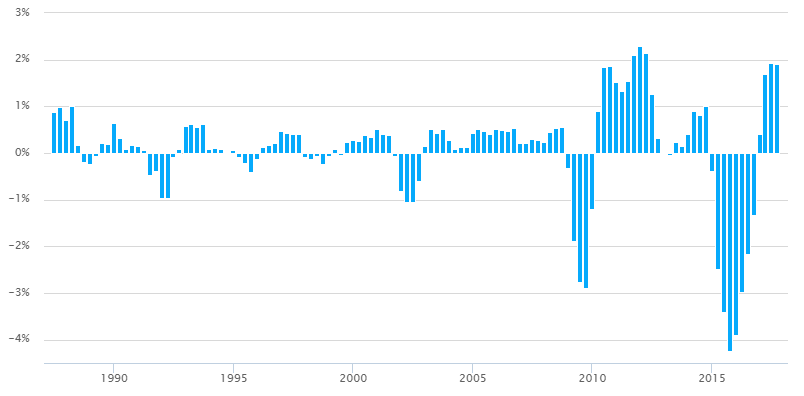
Note: Oil-related assets consist of petroleum and natural gas structures and exploration, mining and oilfield machinery, and railroad equipment.
Sources: PWBM, BEA.
One implication of the oil sector’s increased importance is a change in the relationship between the price of crude oil and US business investment. Figure 2 shows that growth in oil-related investment generally tracks changes in the price of oil with a one- or two- quarter lag. After the price of oil collapsed in 2014, oil-related investment dropped sharply, subtracting nearly three percentage points from growth in total business investment in both 2015 and 2016. When the price rebounded in 2017, so did the oil sector, adding 1.5 percentage points to growth in investment. While oil-related investment is naturally tied to the price of oil, the magnitude of these impacts is much larger than was typical before the shale boom. As a result, changes in the price of oil are now an important driver of changes in overall business investment.
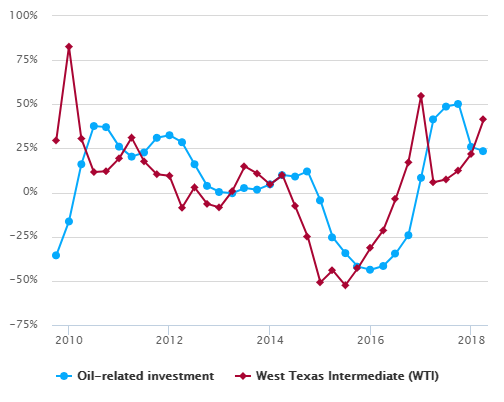
Sources: PWBM, BEA, FRED.
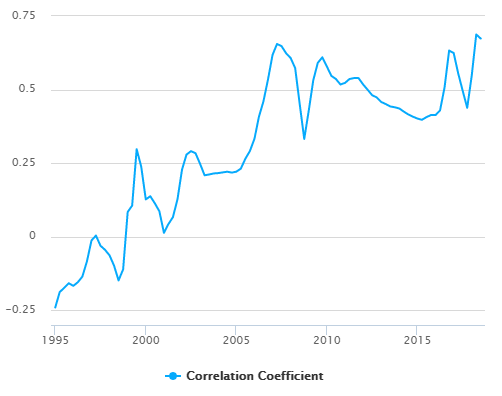
Note: Rolling correlation between year-over-year changes in nonresidential investment and lagged year-over-year changes in the price of WTI.
Sources: PWBM, BEA, FRED.
Figure 3 provides further suggestive evidence of the increased sensitivity of investment to oil prices. The figure shows the time-varying correlation between business investment and the price of oil over the last three decades. Prior to the shale boom, there was no consistent relationship: rising oil prices sometimes coincided with increases in investment, and other times with decreases. As the boom unfolded over the course of the 2000s, however, a substantial positive correlation emerged.
The Impact of Rising Oil Prices on Investment in 2018
The price of West Texas Intermediate (WTI), a medium crude oil used as a benchmark for US production, rose from less than $50 per barrel in the third quarter of 2017 to roughly $70 per barrel in the third quarter of 2018.3 Over the same period, growth in business investment picked up. Nonresidential investment grew seven percent year-over-year in the third quarter of 2018, up from five percent over the same period in 2017 and less than one percent in 2016.
To get a sense of how much the 40 percent rise in the price of oil may have contributed to the increase in investment, I estimate a simple statistical model of the determinants of investment and use it to simulate what would have happened if the price of WTI had been stable.
Oil production is the most direct channel through which the price of oil affects investment, but not the only one. Oil is an important input in some industries, and higher prices mean higher costs. Rising prices also crowd out consumer demand for non-energy goods and services, which reduces businesses’ need to invest. To account for these various channels, the model differentiates across ten different types of equipment and structures investment and allows the effect of oil prices to vary for each.
For simplicity, I assume that the only source of investment other than oil-related activities is industrial demand, captured by industrial production in the manufacturing sector.4 Its effect also varies by type of asset. Changes in the price of WTI and in manufacturing production can affect investment contemporaneously or with a lag. I also include year-fixed effects.
Sources: PWBM, BEA.
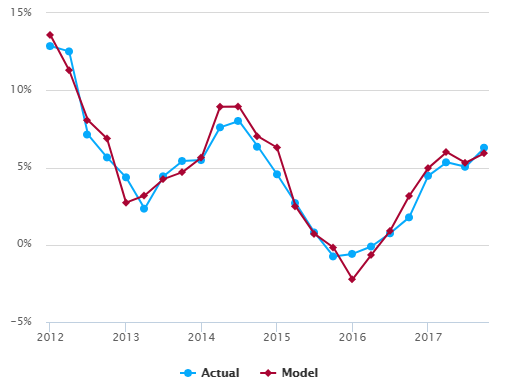
I estimate the model over the period since 2012 using the ten categories of equipment and structures available at quarterly frequency in the National Income and Product Accounts.5 Figure 4 shows how the model matches the data in the estimation sample. Though far from perfect, this simple specification accounts for much of the variation in the growth rate of investment over the last five years.6
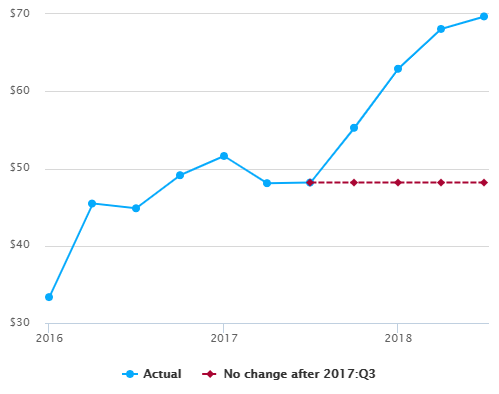
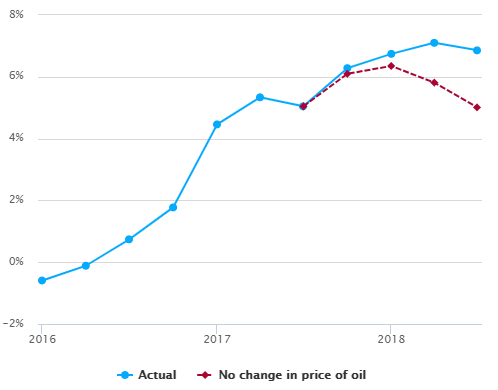
To determine the impact of the increase in oil prices over the last four quarters, I use the estimated coefficients to simulate a counterfactual in which WTI remains fixed at its third-quarter average of $48 per barrel, shown by the dashed line in Figure 5.
Source: FRED.
Sources: PWBM, BEA.
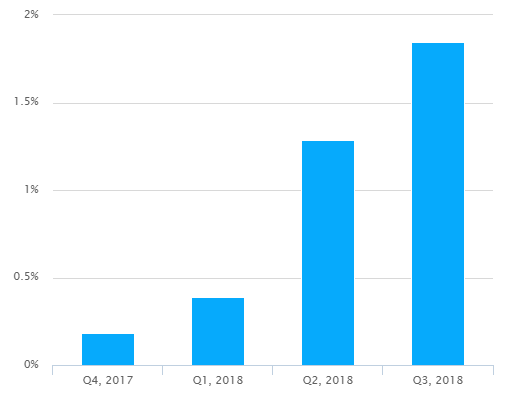
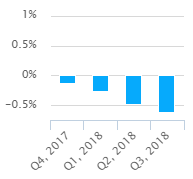
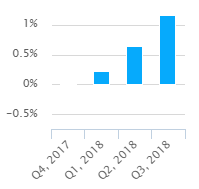
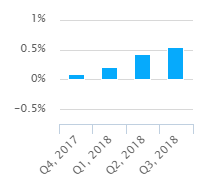
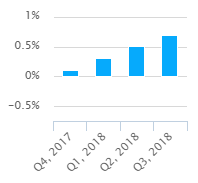
Figures 6 and 7 show the results. I estimate that the increase in oil prices added about 1¾ percentage points to growth in business investment over the last four quarters. Without it, investment would have grown 5 percent year-over-year in the third quarter, the same rate as in 2017. The response to the rise in oil prices explains the entire increase in the growth rate of investment in 2018.
Source: PWBM.
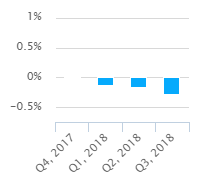
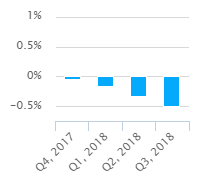
Figure 8 shows the estimated effect of the rise in oil prices on the different types of assets. As expected, oil-related equipment and structures account for most of the increase, with some positive spillovers to other assets. However, these gains are partially offset by declining investment in manufacturing, transportation, and commercial structures.
Commercial and health care
Computers and peripherals
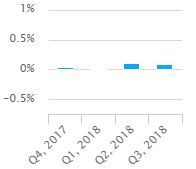
Industrial equipment
Manufacturing structures
Mining, petroleum, gas structures
Office equipment and instruments
Oilfield and other equipment
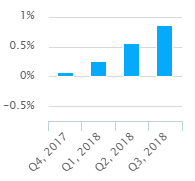
Other structures
Power and communication
Transportation equipment
Source: PWBM.
-
https://www.eia.gov/dnav/pet/hist/LeafHandler.ashx?n=PET&s=WCRFPUS2&f=W ↩
-
For a more complete discussion of the effects of oil on the US economy, see Baumeister and Kilian (2016), https://www.brookings.edu/bpea-articles/lower-oil-prices-and-the-u-s-economy-is-this-time-different ↩
-
Most of this increase has since been reversed. On December 17, the price of WTI fell below $50. ↩
-
Including a more detailed breakdown of industrial production or proxies for non-industrial demand (such as personal consumption expenditures for services or the ISM non-manufacturing index) does not meaningfully affect the results. ↩
-
See section 5.3 of the NIPAs. ↩
-
Fitted values for total nonresidential investment include actual rather than predicted values for intellectual property products, which are not modeled. ↩
    ,Contribution
    7/1/87,0.0087337099
    10/1/87,0.0099390859
    1/1/88,0.0071266529
    4/1/88,0.010022894
    7/1/88,0.0016081846
    10/1/88,-0.0020301057
    1/1/89,-0.0022529818
    4/1/89,-0.0007239223
    7/1/89,0.002170897
    10/1/89,0.001836596
    1/1/90,0.0064796528
    4/1/90,0.0032873965
    7/1/90,0.0008774159
    10/1/90,0.0017573922
    1/1/91,0.0014937613
    4/1/91,0.0006026473
    7/1/91,-0.0047129533
    10/1/91,-0.0038417778
    1/1/92,-0.0096426431
    4/1/92,-0.0096193224
    7/1/92,-0.0008455228
    10/1/92,0.0007708966
    1/1/93,0.0057899611
    4/1/93,0.0061463158
    7/1/93,0.0056298623
    10/1/93,0.0061264789
    1/1/94,0.0009552199
    4/1/94,0.0009760864
    7/1/94,0.0008687765
    10/1/94,-0.0001977898
    1/1/95,0.0005559539
    4/1/95,-0.0009414135
    7/1/95,-0.0021875012
    10/1/95,-0.0039782238
    1/1/96,-0.0013157685
    4/1/96,0.0013785149
    7/1/96,0.0016128917
    10/1/96,0.0021067509
    1/1/97,0.0046366679
    4/1/97,0.0043137261
    7/1/97,0.0040114221
    10/1/97,0.0041616569
    1/1/98,-0.000828545
    4/1/98,-0.0013524316
    7/1/98,-0.0006032765
    10/1/98,-0.0023283322
    1/1/99,-0.0007170017
    4/1/99,0.0008349341
    7/1/99,-0.0003467023
    10/1/99,0.0022633285
    1/1/00,0.0028687276
    4/1/00,0.0025185035
    7/1/00,0.0039239867
    10/1/00,0.0035338425
    1/1/01,0.0050701721
    4/1/01,0.0041242571
    7/1/01,0.0038927838
    10/1/01,-0.0007178865
    1/1/02,-0.0080402861
    4/1/02,-0.0106055752
    7/1/02,-0.0105361345
    10/1/02,-0.0060983292
    1/1/03,0.0014405582
    4/1/03,0.0051861975
    7/1/03,0.0042821676
    10/1/03,0.0051420963
    1/1/04,0.002853671
    4/1/04,0.0007832433
    7/1/04,0.0012697962
    10/1/04,0.0012534551
    1/1/05,0.0041945531
    4/1/05,0.005130123
    7/1/05,0.0047103708
    10/1/05,0.0040658047
    1/1/06,0.0052310464
    4/1/06,0.0048506949
    7/1/06,0.0047187491
    10/1/06,0.0054009747
    1/1/07,0.0021307307
    4/1/07,0.0022212159
    7/1/07,0.0030363807
    10/1/07,0.0028411347
    1/1/08,0.002370156
    4/1/08,0.0044683838
    7/1/08,0.0053800129
    10/1/08,0.0055063783
    1/1/09,-0.0032558073
    4/1/09,-0.0189399575
    7/1/09,-0.0275821558
    10/1/09,-0.0289300219
    1/1/10,-0.0120913671
    4/1/10,0.0089228575
    7/1/10,0.0184373801
    10/1/10,0.0185577436
    1/1/11,0.0152933702
    4/1/11,0.0132493731
    7/1/11,0.0154575309
    10/1/11,0.021059369
    1/1/12,0.0230035691
    4/1/12,0.0213440476
    7/1/12,0.012675247
    10/1/12,0.0032746029
    1/1/13,0.0002871466
    4/1/13,-0.0003455806
    7/1/13,0.0023177413
    10/1/13,0.0014324517
    1/1/14,0.0040561401
    4/1/14,0.0089078975
    7/1/14,0.0080934286
    10/1/14,0.0099959512
    1/1/15,-0.0039465298
    4/1/15,-0.0248429179
    7/1/15,-0.0339689924
    10/1/15,-0.042497855
    1/1/16,-0.039056997
    4/1/16,-0.0297441099
    7/1/16,-0.0216828288
    10/1/16,-0.0133085924
    1/1/17,0.0040117639
    4/1/17,0.0169496186
    7/1/17,0.0192184423
    10/1/17,0.0191782723
    ,Oil-related investment,West Texas Intermediate (WTI)
    10/1/09,-0.355463859,0.295114444
    1/1/10,-0.163487213,0.82678832
    4/1/10,0.160327163,0.305481659
    7/1/10,0.376779922,0.116286696
    10/1/10,0.370643946,0.120560129
    1/1/11,0.260070672,0.193625824
    4/1/11,0.20349062,0.311063334
    7/1/11,0.227123421,0.176578738
    10/1/11,0.310109486,0.103977461
    1/1/12,0.324771465,0.09480633
    4/1/12,0.285326663,-0.085599553
    7/1/12,0.160380688,0.029890256
    10/1/12,0.037915919,-0.063873495
    1/1/13,0.003156291,-0.084077889
    4/1/13,-0.003705118,0.008148638
    7/1/13,0.025582271,0.148235197
    10/1/13,0.016602893,0.107789406
    1/1/14,0.04656718,0.046145493
    4/1/14,0.098877972,0.098862597
    7/1/14,0.090703937,-0.075222016
    10/1/14,0.119714193,-0.249090114
    1/1/15,-0.044350824,-0.508652899
    4/1/15,-0.253581622,-0.440189837
    7/1/15,-0.342951481,-0.525020515
    10/1/15,-0.41955786,-0.427184176
    1/1/16,-0.437067625,-0.312124696
    4/1/16,-0.415860869,-0.21422631
    7/1/16,-0.345348539,-0.035155003
    10/1/16,-0.241606766,0.171663881
    1/1/17,0.083419234,0.547781087
    4/1/17,0.414638757,0.058142283
    7/1/17,0.486912861,0.07424214
    10/1/17,0.501871795,0.124763369
    1/1/18,0.258771367,0.218600645
    4/1/18,0.234719967,0.414970445
    ,Correlation Coefficient
    1/1/95,-0.240413309
    4/1/95,-0.187993734
    7/1/95,-0.173790855
    10/1/95,-0.158260806
    1/1/96,-0.166973348
    4/1/96,-0.15448812
    7/1/96,-0.135382174
    10/1/96,-0.083744138
    1/1/97,-0.012645612
    4/1/97,0.003810654
    7/1/97,-0.03062956
    10/1/97,-0.044571737
    1/1/98,-0.063676017
    4/1/98,-0.098355534
    7/1/98,-0.148488208
    10/1/98,-0.111019372
    1/1/99,0.084111372
    4/1/99,0.105767434
    7/1/99,0.297305347
    10/1/99,0.238154758
    1/1/00,0.126854356
    4/1/00,0.137455852
    7/1/00,0.113701073
    10/1/00,0.086409038
    1/1/01,0.013361541
    4/1/01,0.042910387
    7/1/01,0.066221752
    10/1/01,0.126834198
    1/1/02,0.228062881
    4/1/02,0.279022869
    7/1/02,0.290811613
    10/1/02,0.283542209
    1/1/03,0.247222694
    4/1/03,0.208735027
    7/1/03,0.211445387
    10/1/03,0.21497691
    1/1/04,0.216175702
    4/1/04,0.218535253
    7/1/04,0.220947031
    10/1/04,0.217753428
    1/1/05,0.221032234
    4/1/05,0.231359571
    7/1/05,0.26472226
    10/1/05,0.291252083
    1/1/06,0.332846724
    4/1/06,0.407632687
    7/1/06,0.459884213
    10/1/06,0.534278065
    1/1/07,0.617952025
    4/1/07,0.654937799
    7/1/07,0.647539677
    10/1/07,0.623445734
    1/1/08,0.607069003
    4/1/08,0.573071601
    7/1/08,0.451457625
    10/1/08,0.332234589
    1/1/09,0.429443293
    4/1/09,0.531433025
    7/1/09,0.59070341
    10/1/09,0.609633623
    1/1/10,0.578181497
    4/1/10,0.546526549
    7/1/10,0.536028557
    10/1/10,0.51726479
    1/1/11,0.522649745
    4/1/11,0.535757654
    7/1/11,0.539046446
    10/1/11,0.538930924
    1/1/12,0.517540024
    4/1/12,0.499457367
    7/1/12,0.481068513
    10/1/12,0.47342279
    1/1/13,0.457781715
    4/1/13,0.450885498
    7/1/13,0.442692498
    10/1/13,0.439795588
    1/1/14,0.435738499
    4/1/14,0.425080756
    7/1/14,0.41540309
    10/1/14,0.407961322
    1/1/15,0.401447726
    4/1/15,0.397300778
    7/1/15,0.406202165
    10/1/15,0.413506118
    1/1/16,0.413294875
    4/1/16,0.429013832
    7/1/16,0.507122572
    10/1/16,0.632501412
    1/1/17,0.624288935
    4/1/17,0.55588011
    7/1/17,0.496442375
    10/1/17,0.438036753
    1/1/18,0.548187233
    4/1/18,0.687295482
    7/1/18,0.673253418
    ,Actual,Model
    1/1/12,0.128585916,0.135805655
    4/1/12,0.12514852,0.112949696
    7/1/12,0.071333992,0.080548513
    10/1/12,0.056517719,0.068785805
    1/1/13,0.043640763,0.027255216
    4/1/13,0.023353322,0.031845234
    7/1/13,0.04429937,0.042460711
    10/1/13,0.054214216,0.046990947
    1/1/14,0.054783918,0.056429187
    4/1/14,0.076004025,0.089387162
    7/1/14,0.08013261,0.089460226
    10/1/14,0.063435968,0.070163207
    1/1/15,0.04559955,0.062947404
    4/1/15,0.026989856,0.024819589
    7/1/15,0.007968139,0.00701685
    10/1/15,-0.007557815,-0.001803291
    1/1/16,-0.005919774,-0.022373902
    4/1/16,-0.001152994,-0.006566744
    7/1/16,0.007394402,0.009008385
    10/1/16,0.017727755,0.031585829
    1/1/17,0.04460462,0.049591663
    4/1/17,0.05336874,0.060025951
    7/1/17,0.050445072,0.053065862
    10/1/17,0.062797686,0.059236959
    ,Actual,No change after 2017:Q3
    1/1/16,33.3518,
    4/1/16,45.46063,
    7/1/16,44.85187,
    10/1/16,49.13556,
    1/1/17,51.62129,
    4/1/17,48.10381,
    7/1/17,48.18177,48.18177
    10/1/17,55.26587,48.18177
    1/1/18,62.90574,48.18177
    4/1/18,68.06547,48.18177
    7/1/18,69.6873,48.18177
    ,Actual,No change in price of oil
    1/1/16,-0.005919774,
    4/1/16,-0.001152994,
    7/1/16,0.007394402,
    10/1/16,0.017727755,
    1/1/17,0.04460462,
    4/1/17,0.05336874,
    7/1/17,0.050445072,0.05044507
    10/1/17,0.062797686,0.06096452
    1/1/18,0.067425739,0.06351208
    4/1/18,0.070991908,0.05812857
    7/1/18,0.068560724,0.05009394
    ,Oil price effect
    2017 Q4,0.001833169
    2018 Q1,0.00391366
    2018 Q2,0.012863337
    2018 Q3,0.01846678
    ,Data
    2017 Q4,-0.0001783139
    2018 Q1,-0.0013359417
    2018 Q2,-0.0016543731
    2018 Q3,-0.0027251315
    2017 Q4,0.0003184641
    2018 Q1,0.0001880198
    2018 Q2,0.0010036488
    2018 Q3,0.0009246681
    2017 Q4,0.0004444341
    2018 Q1,-0.0002998371
    2018 Q2,0.0006248569
    2018 Q3,-0.0001950367
    2017 Q4,-0.001234481
    2018 Q1,-0.002683457
    2018 Q2,-0.004883533
    2018 Q3,-0.006077847
    2017 Q4,0.0001711245
    2018 Q1,0.0022652564
    2018 Q2,0.0065201595
    2018 Q3,0.0116286412
    2017 Q4,0.000873067
    2018 Q1,0.002003289
    2018 Q2,0.004185956
    2018 Q3,0.00551334
    2017 Q4,0.0007123841
    2018 Q1,0.0026257731
    2018 Q2,0.0055264916
    2018 Q3,0.0085566202
    2017 Q4,0.0001791192
    2018 Q1,-0.0001959095
    2018 Q2,-0.0003131666
    2018 Q3,-0.0010530906
    2017 Q4,0.001013598
    2018 Q1,0.003026244
    2018 Q2,0.005117113
    2018 Q3,0.006871552
    2017 Q4,-0.0004662271
    2018 Q1,-0.0016797776
    2018 Q2,-0.0032638169
    2018 Q3,-0.004976932