To finance government spending above tax revenues, the federal government issues debt. According to USAFacts, in 2015 the federal government paid more than $220 billion in interest on this debt. Moreover, interest on the federal debt is growing larger, and it is becoming an increasingly important part of PWBM’s long-term budget projections. To make more accurate projections of interest paid on the federal debt, PWBM will begin projecting the maturity structure of federal debt.
The maturity structure of federal debt determines how much federal debt is being paid off or retired each year, which determines the speed with which changes to interest rates affect total interest paid on the federal debt. Retired debt is typically rolled over into new debt at prevailing interest rates. When more debt is retired and rolled into new debt, changes to interest rates are passed through faster to interest paid by the federal government.
To inform our projections about the maturity structure of federal debt, we analyze historical debt maturity structure by using U.S. Treasury records dating back to 1953. We find that the maturity structure changes significantly in the few years following 1982 and 2007, but is relatively stable in other years. Beginning in those two years, the federal government moves away from issuing short-term (one-year or less) debt and shifts toward long-term borrowing.
As shown in Figure 1, the federal government decreased its concentration of debt obligations in short-term debt (Treasury bills with one-year or less maturity) from around 45 percent of all federal debt in 1982 to around 35 percent in 1987. The decrease in the short-term debt composition of public debt can be attributed to the U.S. Treasury’s preference for new 20- and 30-year debt. In 2007, we observe another decline in short-term debt composition of public debt from 35 percent to 25 percent in 2012. In 2007, the Treasury shifted away from short-term debt to both medium- and long-term securities. Securities due in three to ten years more than tripled between 2007 and 2012. Furthermore, the U.S. Treasury was issuing more than $150 billion of 30-year debt in 2012, compared to $0, $26 billion, and $38 billion in 2005, 2006, and 2007, respectively.
To view additional years, please view chart online*
Source: U.S. Department of the Treasury, Monthly Statements of the Public Debt, December 1982 to December 2017
The decreases in the proportion of short-term debt starting in 1982 and 2007 are coincident with sudden, large increases in public debt. As shown in Figure 2, the debt as a share of GDP increased from 25 percent in 1981 to 40 percent in 1987 following the Economic Recovery Tax Act of 1981. Likewise, decreased tax revenues and increased spending during the 2008 financial crisis contributed to a substantial increase in federal debt from 2007 to 2012. Between those years, debt as a share of GDP increased from 35 percent to 70 percent. Large increases in debt held by the public give the Treasury a chance to reshape the maturity structure. In both cases, the Treasury had to refinance existing short-term debt that was coming due and issue new debt to cover the larger deficits. In both instances, the U.S. Treasury borrowed larger shares of medium- and long-term debt.
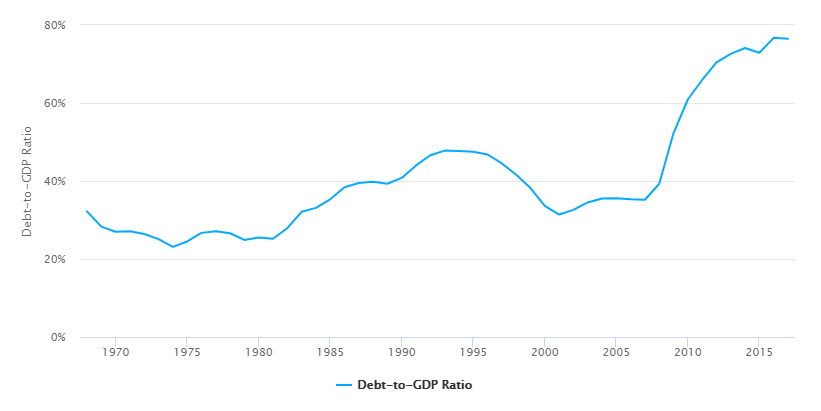
Source: Congressional Budget Office, The 2018 Long-Term Budget Outlook
PWBM projects that the future maturity structure of U.S. debt will remain similar to the maturity structure observed in both 2012 and 2017, given that there are no sudden projected changes in the debt-to-GDP ratio. We project that about a quarter of U.S. government debt obligations will be in short-term (one-year or less) debt, and the rest of the debt will be spread fairly evenly among each of the other, longer-term securities as shown in Figure 1. The recent increased use of long-term debt will slow the change in the interest paid on federal debt compared to earlier years. Previously, up to half of the entire federal debt was rolled over into new debt each year at new interest rates as it matured.
Maturity (years),Total,1,2,3,4-5,6-7,8-10,11-30
1953,154630.58,73235.31,14287.05,2237.74,12842.11,8341.44,11950.9,31736.03
1957,161448.71,74368.42,10065.33,6688.19,29759.52,7673.48,3598.93,29294.84
1962,195944.29,87284.18,24002.27,10861.22,26776.77,15091.63,18890.98,13037.24
1967,222106.66,104362.7,25967.62,18672.95,33518.47,18859.12,0,20725.8
1972,269509.21,130422.5,31689.4,26701.25,30173.18,21154.83,7988.25,21379.8
1977,459929,224817,66742,37560,52838,25176,20152,32644
1982,880881,411708,133219,71938,80892,48881,41035,93208
1987,1749864,655952,248126,155414,181907,125733,113497,269235
1992,2739788,997349,387792,199245,389847,174728,159734,431093
1997,3441819,1246476,543224,305223,448026,151816,232527,514527
2002,3205137,1270428,551491,162149,288466,160636,232451,539516
2007,4522493,1616452,630216,330945,575727,316515,488134,564504
2012,11046014,2866776,1435129,1126457,1947942,1290599,1154257,1224854
2017,14377262,3733149,1971029,1499215,2494107,1501550,1206058,1972154
Year,Debt-to-GDP Ratio
1968,32.2
1969,28.3
1970,27
1971,27.1
1972,26.4
1973,25.1
1974,23.1
1975,24.5
1976,26.7
1977,27.1
1978,26.6
1979,24.9
1980,25.5
1981,25.2
1982,27.9
1983,32.1
1984,33.1
1985,35.3
1986,38.4
1987,39.5
1988,39.8
1989,39.3
1990,40.8
1991,44
1992,46.6
1993,47.8
1994,47.7
1995,47.5
1996,46.8
1997,44.5
1998,41.6
1999,38.2
2000,33.6
2001,31.4
2002,32.6
2003,34.5
2004,35.5
2005,35.6
2006,35.3
2007,35.2
2008,39.3
2009,52.3
2010,60.9
2011,65.9
2012,70.4
2013,72.6
2014,74.1
2015,72.9
2016,76.7
2017,76.5