By Alexander Arnon
“Born in other countries, yet believing you could be happy in this, our laws acknowledge, as they should do, your right to join us in society, conforming, as I doubt not you will do, to our established rules.”
The number of naturalized U.S. citizens has more than doubled over the last quarter century, rising from around 9 million in 1996 to 21 million in 2018.1 PWBM projects that by 2050, it will reach nearly 35 million. At that point, more than half of all immigrants will be citizens and one in ten U.S. citizens will be foreign-born.
A Growing Share of Immigrants are Choosing to Become Citizens
Legal Permanent Residents (LPRs) who are at least 18 years old and have been in the U.S. for at least five years – or who are married to U.S. citizens and have been in the U.S. for at least three years – are eligible to naturalize and become U.S. citizens.
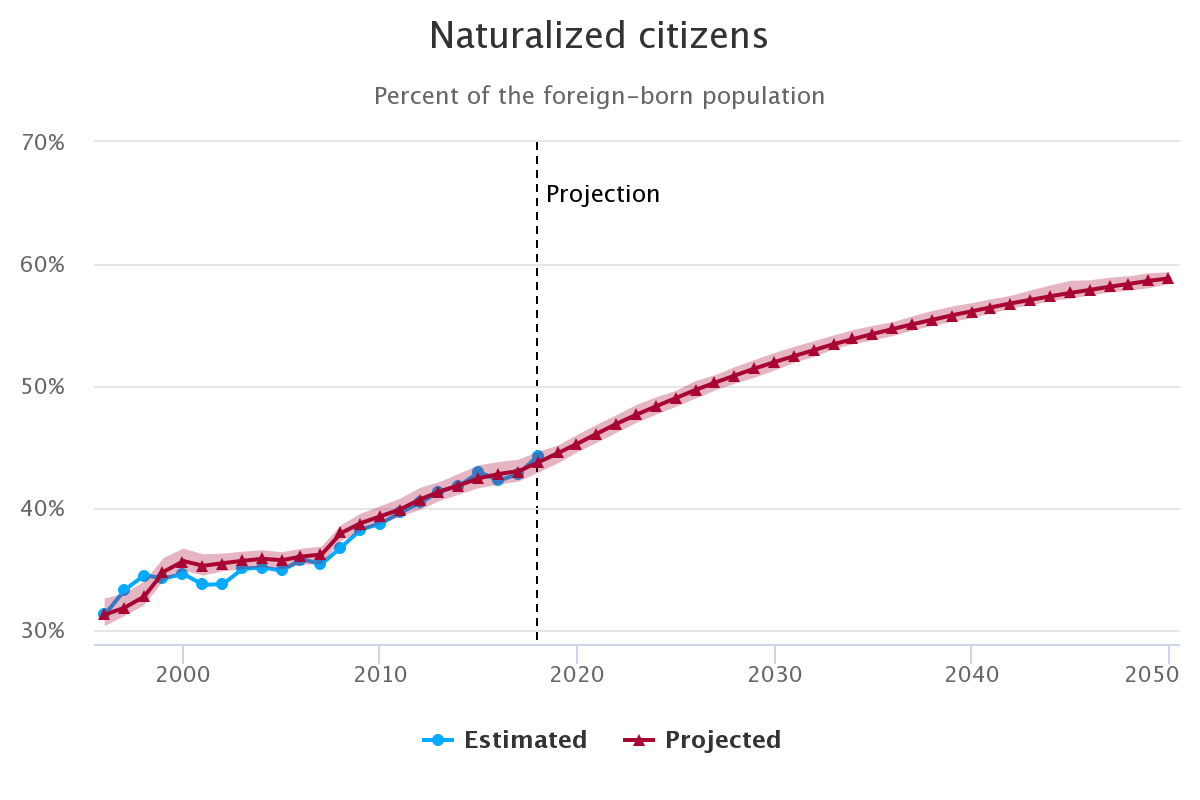
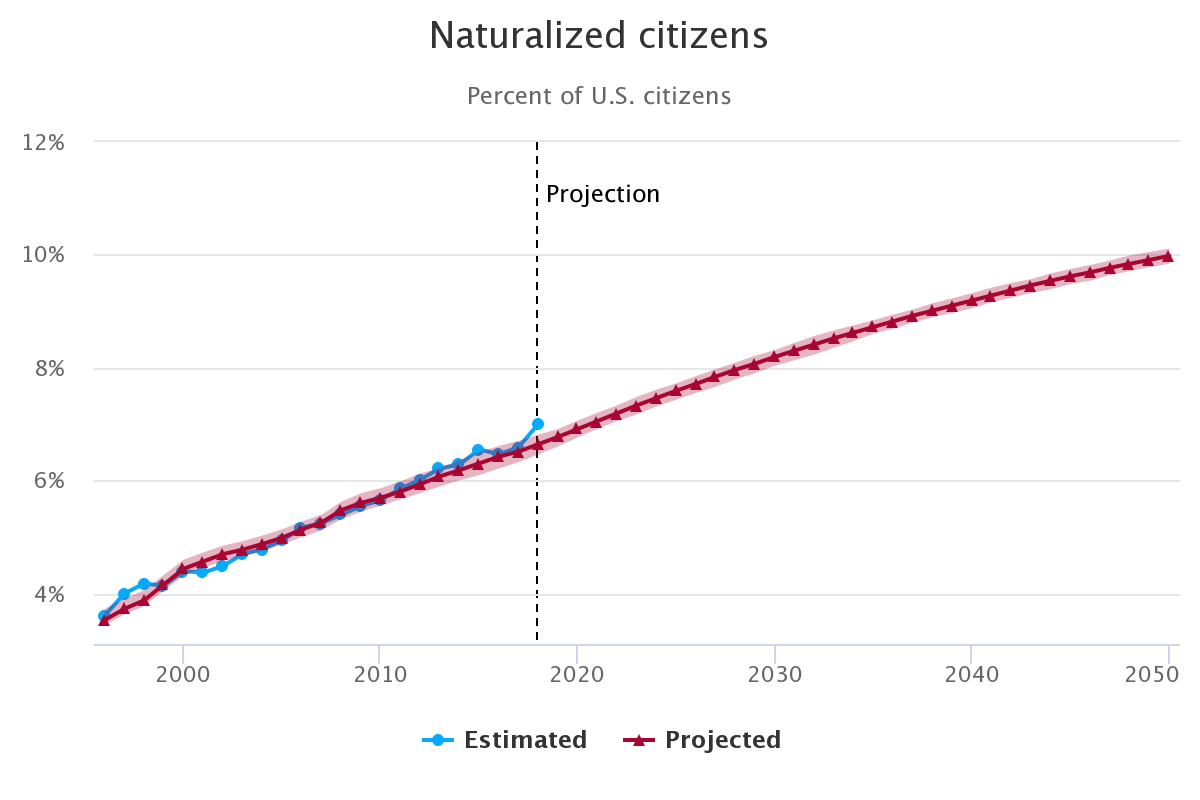
The number of naturalized citizens rose at a steady pace over the last two decades but has increased unevenly as a share of the total foreign-born population. Between 1998 and 2007, the share of foreign-born U.S. residents who were naturalized citizens was stable, rising less than a percentage point. It began to increase rapidly after 2007, rising from 35 percent to 44 percent in 2018. PWBM projects that it will continue to rise over the next decade at roughly the same pace as in recent years and then begin to taper off. By the end of the 2020s, more than half of all immigrants will be citizens, and by 2050, the share will approach 60 percent. The share of U.S. citizens who obtained citizenship through naturalization rather than birth – which doubled between 1996 and 2018 from 3.6 percent to 7 percent – we project to reach 10 percent by 2050.
Figure 1 shows PWBM’s estimates of the naturalized citizen population and its projected evolution through 2050. To view the projected shares of the foreign-born population or of U.S. citizens, use the dropdown menu. PWBM projects the number of naturalized citizens using a stochastic microsimulation model of the U.S. population and economy. Beginning with a representative sample of U.S. households drawn from survey data, the model simulates lifetime demographic and economic outcomes for each individual. See the callout box for a brief description of the model.
Metric
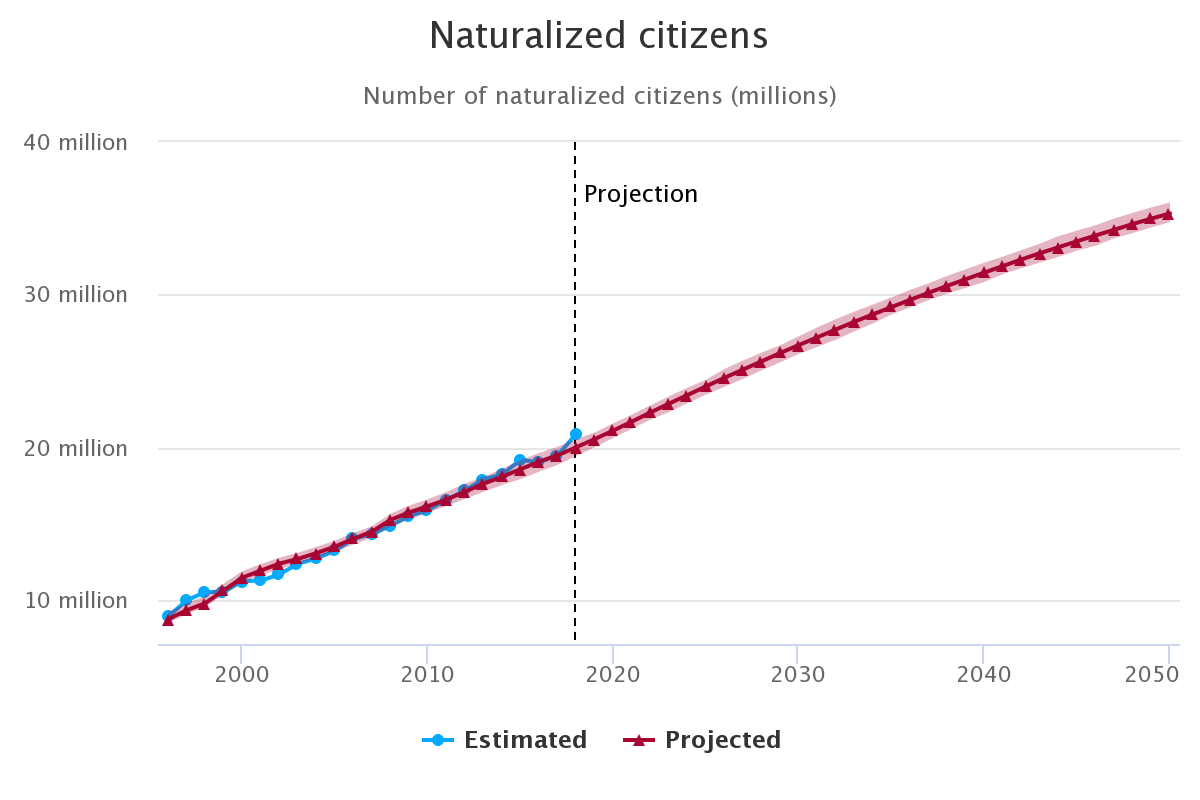
Source: PWBM based on augmented CPS ASEC and the PWBM microsimulation model.
Note: The solid red line shows the average outcome from 50 simulations of PWBM's microsimulation model. The red shaded area shows the range between the highest and lowest outcomes for each year across all simulations.
In Figure 1, the blue line is PWBM’s estimate of the naturalized citizen population. To verify that PWBM’s microsimulation captures the historical dynamics of the naturalized population, the model was initialized with a sample of households from 1996 and simulated over the 22 years for which historical estimates are available, as well as future decades.2 The historical and future naturalized population predicted by the microsimulation model is shown in red. The solid red line shows the average outcome from 50 simulations of the model, and the red shaded area shows the range between the highest and lowest outcomes for each year across all simulations. This range reflects random variation between different simulations of the same underlying process. Differences between values within the range are not meaningful.
Changes in the Origins of Lawful Immigrants have Raised Naturalization Rates
The rise since 2007 in the share of immigrants who are naturalized citizens and its continuation in PWBM’s projections both reflect recent shifts in the composition of immigrants to the U.S.3 Immigrants from some countries are more likely to naturalize than others. As a result, changes over time in the origins of the foreign-born population can affect the overall naturalization rate. Figure 2 shows the share of lawful immigrants from Mexico, Canada, and various regions who were naturalized citizens in 2018. Immigrants from Mexico and Central America were the least likely to have naturalized; only about 40 percent were U.S. citizens. By contrast, more than two thirds of European and more than 60 percent of Asian immigrants were naturalized citizens.
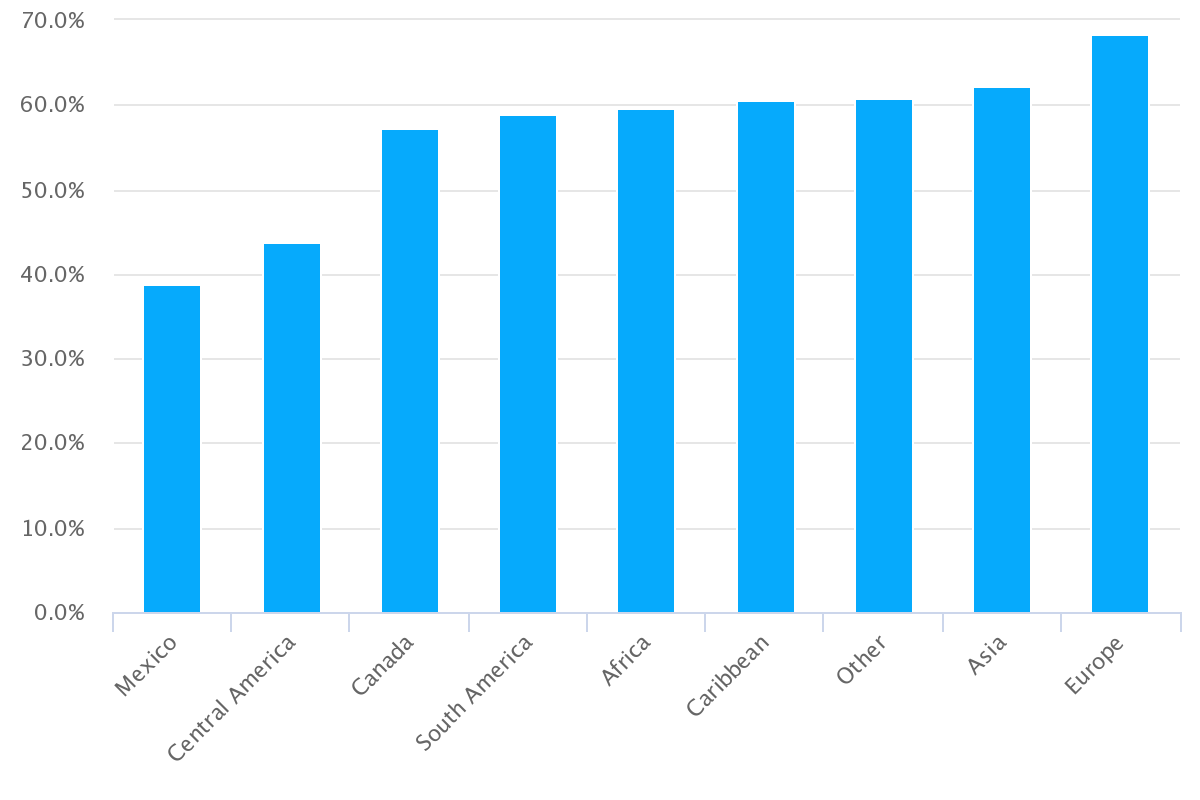
Source: PWBM based on augmented CPS ASEC.
Since 2007, there has been a shift in where lawful immigrants to the U.S. come from. Figure 3 shows the share of lawful immigrants arriving from each country or region in the decades before and after 2007, as well as in PWBM’s projections.4 About 20 percent of lawful immigrants who arrived between 1996 and 2007 came from Mexico, compared with only 11 percent in the subsequent decade. That 9 percentage point decline was mostly offset by an increase in the share coming from Asia. Lawful immigration from Europe also decreased in importance, while the share coming from Africa rose by half. Altogether, PWBM estimates that these shifts increased the share of lawful immigrants who naturalized or are likely to do so in the future.
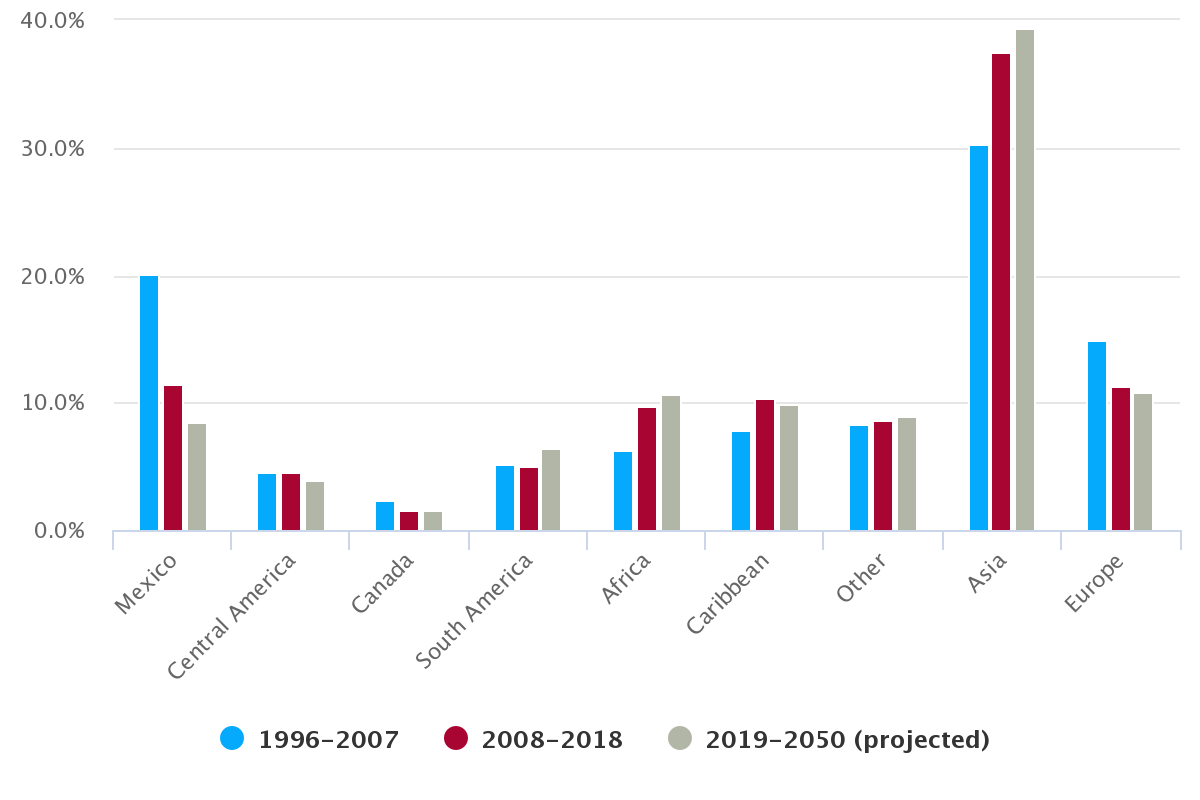
Source: PWBM based on augmented CPS ASEC and the PWBM microsimulation model.
Note: Projections are the average outcome from 50 simulations of PWBM's microsimulation model. Arrivals refer to unauthorized immigrants who established residence in the U.S. in the previous year.
PWBM projects that these trends in the origins of new immigrants will continue for the next several years and then stabilize. On average, PWBM expects nearly 40 percent of lawful immigrants arriving over the next three decades to come from Asia while less than 10 percent come from Mexico. This shift contributes to the continued rise in the naturalized share of immigrants in PWBM’s projections.
Immigrants Who are Long-Term Residents Are More Likely to Naturalize
Figure 4 shows the average number of years foreign-born adults have resided in the U.S., historically and in PWBM’s projections. Average years of residence changed little in the late 1990s and early 2000s but began to rise after 2005. Since then, it has increased by four years, or more than a fifth. This change is largely driven by declining immigration from Mexico. PWBM expects this trend to continue over the next several LPRdecades.
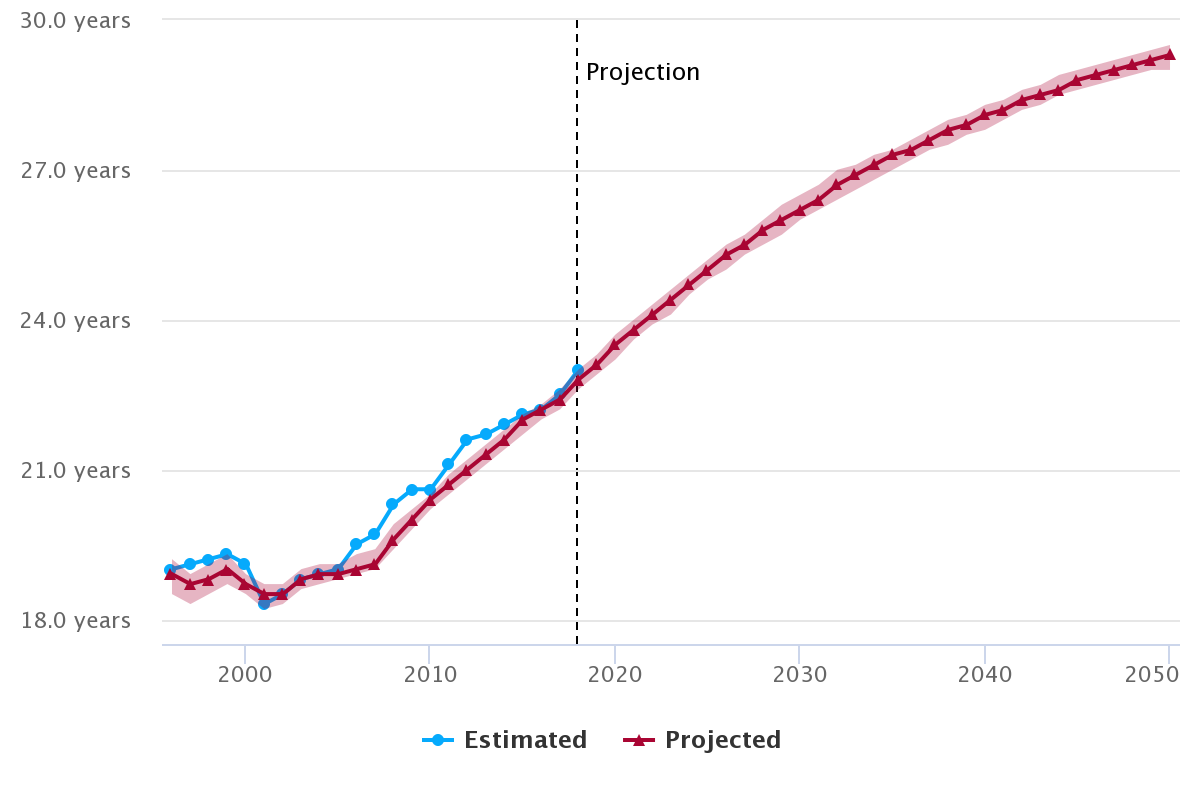
Source: PWBM based on augmented CPS ASEC and the PWBM microsimulation model.
Note: The solid red line shows the average outcome from 50 simulations of PWBM's microsimulation model. The red shaded area shows the range between the highest and lowest outcomes for each year across all simulations.
The rise in how long immigrants remain in the U.S. has both a direct and indirect effect on naturalizations. Directly, immigrants must reside in the U.S. as LPRs for at least five years before naturalizing (three years if married to a U.S. citizen), so the growing share of immigrants who are long-term residents means that more of the foreign-born population meets these eligibility requirements. Unless future immigrants are less likely to naturalize than previous cohorts, the increase in the eligible population implies an increase in naturalizations. Indirectly, PWBM estimates that the likelihood an eligible immigrant chooses to naturalize increases with years of residence. As the foreign-born population becomes increasingly settled, we expect that a growing share of eligible immigrants will choose to become citizens.
Sources and Methods
PWBM’s historical estimates are based primarily on the Current Population Survey’s Annual Social and Economic Supplement (CPS ASEC). The survey provides basic information about immigrants, such as country of origin, year of arrival, and U.S. citizenship. However, some recent immigrants in the CPS report that they are citizens even though they do not satisfy the criteria for naturalization. PWBM adjusts the CPS data to account for this overreporting of citizenship, changing ineligible immigrants to noncitizens.
Other than citizenship, the CPS does not provide any information about the legal status of immigrants. To obtain estimates for the lawful immigrant population, PWBM assigns a legal status to all immigrants in the CPS ASEC sample. Drawing on estimates and methods developed by the Pew Research Center and on data from the Department of Homeland Security, immigrants are assigned to one of four legal status categories: naturalized citizen, lawful permanent resident, other lawful immigrant (referred to as a “nonimmigrant”), or unauthorized immigrant. In addition, the CPS population weights are adjusted to account for discontinuities in the original data, data revisions, and undercounting of the foreign-born population. See PWBM’s model documentation for more information.
Projections and historical simulations are from PWBM’s stochastic microsimulation model of the U.S. population and economy. Beginning with a representative sample of U.S. households drawn from the CPS, the model simulates lifetime demographic and economic outcomes for each individual. These outcomes include marriage, childbirth, education, employment, earnings, geographic mobility, adjustments of legal status, and death, for example. As the initial population drawn from the CPS dies off or emigrates, they are replaced by new generations who were born or immigrated within the simulation.
By simulating the evolution of each individual in a representative sample, microsimulation models can match the heterogeneity observed in the actual population and account for complex interactions between outcomes. Stochastic microsimulation models rely in part on randomness to replicate the real-world distribution of individual outcomes. For example, the likelihood that an individual will give birth depends on her age, marital status, and other attributes, but also on a variety of other factors not explicitly accounted for in the model. These factors are treated as random: different individuals with the same attributes have equal probability of giving birth in the model, but whether they actually do depends on an individualized random draw. Across the full range of simulated attributes and events, this random element means that two individuals who begin a year identical in terms of all observable characteristics can end the year having experienced very different outcomes.
Because the model is partly random, each simulation can generate different results even if all parameters and assumptions are the same. PWBM simulates the model many times and takes the average as its central estimate, using the variation across runs to assess the model’s precision. In Figures 1 and 4, the solid red line shows the average outcome from 50 runs of the microsimulation, while the red shaded area shows the range between the highest and lowest outcomes for each year across all simulations.
Immigration inflows and model parameters governing immigrants’ demographic and economic attributes are derived primarily from the augmented CPS ASEC. Model parameters governing naturalization are based on data from the Department of Homeland Security’s Yearbook of Immigration Statistics For more information, see PWBM’s model documentation.
-
PWBM’s estimates of the naturalized citizen population are based on the Current Population Survey’s Annual Social and Economic Supplement (CPS ASEC). See the callout box for additional information. ↩
-
The historical simulation is based on PWBM’s estimates of migration flows since the mid-1990s. Because there is no detailed historical data on these flows, PWBM estimates them using a variety of sources; see the postscript and model documentation for more information.
The projection is simply a continuation of the historical simulation, replacing estimated historical flows with forecasted future flows. Hence, any prediction errors accumulated over the historical simulation are carried forward through the projection. Normally, PWBM does not run historical simulations when generating projections; instead, the model is initialized with a representative sample of households drawn from the most recent survey data and the simulation is run for the projection period only. The historical simulation is included here for illustrative purposes, even though this simulation results in slightly different projections. ↩ -
For a discussion of recent shifts in the composition of unauthorized immigration, see https://budgetmodel.wharton.upenn.edu/issues/2019/6/26/projections-for-the-evolution-of-the-unauthorized-immigrant-population-in-the-united-states. ↩
-
PWBM’s estimates of lawful immigrant arrivals only include individuals who establish residence in the U.S. Short-term migrants, such as travelers and seasonal workers, are not included. ↩
  Year,Estimated,Projected,{Projected min},{Projected max}
  1996,8.96,8.78,8.54,9.27
  1997,10.01,9.37,9.12,9.83
  1998,10.57,9.83,9.58,10.30
  1999,10.56,10.67,10.41,11.12
  2000,11.28,11.50,11.20,11.93
  2001,11.30,11.97,11.64,12.39
  2002,11.72,12.42,12.09,12.81
  2003,12.41,12.73,12.41,13.13
  2004,12.76,13.11,12.77,13.52
  2005,13.27,13.54,13.21,13.92
  2006,14.04,14.05,13.67,14.43
  2007,14.35,14.52,14.13,14.87
  2008,14.91,15.29,14.84,15.69
  2009,15.54,15.77,15.33,16.22
  2010,15.91,16.18,15.75,16.63
  2011,16.59,16.61,16.19,17.11
  2012,17.20,17.12,16.65,17.65
  2013,17.94,17.65,17.12,18.09
  2014,18.25,18.10,17.56,18.63
  2015,19.21,18.60,17.95,19.19
  2016,19.05,19.09,18.44,19.66
  2017,19.51,19.51,18.88,20.07
  2018,20.91,20.03,19.47,20.56
  2019,,20.57,20.03,21.00
  2020,,21.13,20.65,21.60
  2021,,21.71,21.24,22.17
  2022,,22.31,21.84,22.77
  2023,,22.89,22.33,23.37
  2024,,23.45,22.92,23.93
  2025,,24.02,23.48,24.46
  2026,,24.58,24.00,25.16
  2027,,25.12,24.51,25.71
  2028,,25.66,25.07,26.23
  2029,,26.20,25.59,26.71
  2030,,26.72,26.14,27.30
  2031,,27.23,26.60,27.88
  2032,,27.74,27.07,28.42
  2033,,28.25,27.62,28.91
  2034,,28.73,28.14,29.38
  2035,,29.21,28.72,29.84
  2036,,29.68,29.19,30.33
  2037,,30.14,29.66,30.76
  2038,,30.59,30.09,31.25
  2039,,31.03,30.46,31.68
  2040,,31.46,30.85,32.11
  2041,,31.89,31.36,32.51
  2042,,32.32,31.75,32.93
  2043,,32.73,32.12,33.36
  2044,,33.12,32.49,33.85
  2045,,33.51,32.90,34.21
  2046,,33.89,33.22,34.56
  2047,,34.26,33.70,35.00
  2048,,34.64,34.05,35.37
  2049,,34.99,34.41,35.72
  2050,,35.33,34.76,36.06
  Year,Estimated,Projected,{Projected min},{Projected max}
  1996,0.3125,0.3127,0.3032,0.3259
  1997,0.3327,0.3184,0.3115,0.3299
  1998,0.3450,0.3275,0.3203,0.3396
  1999,0.3425,0.3480,0.3407,0.3593
  2000,0.3460,0.3566,0.3488,0.3669
  2001,0.3372,0.3528,0.3447,0.3622
  2002,0.3377,0.3549,0.3482,0.3627
  2003,0.3504,0.3569,0.3499,0.3643
  2004,0.3513,0.3585,0.3515,0.3655
  2005,0.3489,0.3574,0.3500,0.3639
  2006,0.3581,0.3604,0.3535,0.3668
  2007,0.3542,0.3620,0.3543,0.3684
  2008,0.3680,0.3797,0.3731,0.3861
  2009,0.3825,0.3878,0.3810,0.3956
  2010,0.3873,0.3934,0.3875,0.4016
  2011,0.3963,0.3991,0.3929,0.4078
  2012,0.4045,0.4072,0.3986,0.4166
  2013,0.4138,0.4137,0.4059,0.4215
  2014,0.4184,0.4189,0.4112,0.4283
  2015,0.4295,0.4246,0.4164,0.4352
  2016,0.4226,0.4280,0.4193,0.4378
  2017,0.4282,0.4304,0.4218,0.4398
  2018,0.4433,0.4376,0.4291,0.4462
  2019,,0.4452,0.4367,0.4514
  2020,,0.4530,0.4460,0.4602
  2021,,0.4613,0.4538,0.4686
  2022,,0.4694,0.4620,0.4764
  2023,,0.4768,0.4701,0.4848
  2024,,0.4837,0.4767,0.4909
  2025,,0.4904,0.4831,0.4963
  2026,,0.4971,0.4899,0.5043
  2027,,0.5031,0.4966,0.5091
  2028,,0.5089,0.5021,0.5158
  2029,,0.5146,0.5070,0.5216
  2030,,0.5198,0.5129,0.5272
  2031,,0.5248,0.5192,0.5323
  2032,,0.5296,0.5240,0.5369
  2033,,0.5345,0.5303,0.5416
  2034,,0.5387,0.5344,0.5460
  2035,,0.5429,0.5375,0.5495
  2036,,0.5469,0.5411,0.5525
  2037,,0.5508,0.5455,0.5573
  2038,,0.5544,0.5494,0.5616
  2039,,0.5581,0.5527,0.5652
  2040,,0.5614,0.5556,0.5680
  2041,,0.5647,0.5596,0.5712
  2042,,0.5679,0.5637,0.5741
  2043,,0.5708,0.5661,0.5785
  2044,,0.5737,0.5698,0.5826
  2045,,0.5764,0.5715,0.5863
  2046,,0.5789,0.5744,0.5867
  2047,,0.5815,0.5767,0.5888
  2048,,0.5839,0.5782,0.5901
  2049,,0.5863,0.5803,0.5925
  2050,,0.5883,0.5836,0.5933
  Year,Estimated,Projected,{Projected min},{Projected max}
  1996,0.0360,0.0352,0.0343,0.0372
  1997,0.0399,0.0372,0.0362,0.0390
  1998,0.0417,0.0387,0.0377,0.0405
  1999,0.0413,0.0415,0.0404,0.0432
  2000,0.0439,0.0443,0.0431,0.0459
  2001,0.0436,0.0456,0.0444,0.0472
  2002,0.0448,0.0469,0.0457,0.0484
  2003,0.0469,0.0477,0.0465,0.0492
  2004,0.0478,0.0487,0.0474,0.0502
  2005,0.0493,0.0498,0.0486,0.0513
  2006,0.0516,0.0513,0.0499,0.0527
  2007,0.0524,0.0525,0.0511,0.0539
  2008,0.0539,0.0547,0.0531,0.0562
  2009,0.0554,0.0560,0.0544,0.0577
  2010,0.0565,0.0569,0.0555,0.0586
  2011,0.0585,0.0580,0.0566,0.0598
  2012,0.0601,0.0593,0.0577,0.0612
  2013,0.0621,0.0607,0.0589,0.0622
  2014,0.0628,0.0618,0.0600,0.0636
  2015,0.0655,0.0630,0.0609,0.0650
  2016,0.0646,0.0642,0.0621,0.0661
  2017,0.0659,0.0651,0.0632,0.0670
  2018,0.0700,0.0664,0.0646,0.0681
  2019,,0.0677,0.0660,0.0691
  2020,,0.0691,0.0676,0.0706
  2021,,0.0705,0.0691,0.0720
  2022,,0.0719,0.0705,0.0733
  2023,,0.0733,0.0717,0.0748
  2024,,0.0746,0.0731,0.0761
  2025,,0.0759,0.0743,0.0772
  2026,,0.0771,0.0755,0.0785
  2027,,0.0784,0.0766,0.0797
  2028,,0.0796,0.0779,0.0809
  2029,,0.0807,0.0790,0.0821
  2030,,0.0819,0.0803,0.0831
  2031,,0.0830,0.0813,0.0844
  2032,,0.0841,0.0823,0.0856
  2033,,0.0852,0.0835,0.0866
  2034,,0.0862,0.0847,0.0875
  2035,,0.0872,0.0860,0.0884
  2036,,0.0882,0.0869,0.0894
  2037,,0.0892,0.0880,0.0903
  2038,,0.0901,0.0889,0.0914
  2039,,0.0910,0.0897,0.0923
  2040,,0.0919,0.0905,0.0932
  2041,,0.0928,0.0916,0.0942
  2042,,0.0937,0.0924,0.0950
  2043,,0.0946,0.0932,0.0957
  2044,,0.0954,0.0939,0.0967
  2045,,0.0962,0.0948,0.0975
  2046,,0.0969,0.0954,0.0982
  2047,,0.0977,0.0964,0.0990
  2048,,0.0984,0.0971,0.0999
  2049,,0.0991,0.0978,0.1005
  2050,,0.0998,0.0984,0.1011
  Region,Share
  Mexico,0.387
  Central America,0.438
  Canada,0.573
  South America,0.589
  Africa,0.595
  Caribbean,0.606
  Other,0.608
  Asia,0.621
  Europe,0.683
  Region,1996-2007,2008-2018,2019-2050 (projected)
  Mexico,0.201,0.114,0.085
  Central America,0.046,0.045,0.039
  Canada,0.024,0.015,0.015
  South America,0.052,0.05,0.065
  Africa,0.062,0.097,0.106
  Caribbean,0.079,0.104,0.099
  Other,0.083,0.087,0.089
  Asia,0.303,0.375,0.394
  Europe,0.149,0.113,0.108
  Year,Estimated,Projected,{Projected min},{Projected max}
  1996,19.0,18.9,18.5,19.2
  1997,19.1,18.7,18.3,18.9
  1998,19.2,18.8,18.5,19.1
  1999,19.3,19.0,18.7,19.3
  2000,19.1,18.7,18.5,18.9
  2001,18.3,18.5,18.2,18.7
  2002,18.5,18.5,18.3,18.7
  2003,18.8,18.8,18.6,19.0
  2004,18.9,18.9,18.7,19.1
  2005,19.0,18.9,18.8,19.1
  2006,19.5,19.0,18.9,19.3
  2007,19.7,19.1,19.0,19.4
  2008,20.3,19.6,19.4,19.9
  2009,20.6,20.0,19.8,20.2
  2010,20.6,20.4,20.2,20.5
  2011,21.1,20.7,20.5,20.9
  2012,21.6,21.0,20.8,21.2
  2013,21.7,21.3,21.1,21.5
  2014,21.9,21.6,21.4,21.8
  2015,22.1,22.0,21.7,22.1
  2016,22.2,22.2,22.0,22.3
  2017,22.5,22.4,22.2,22.6
  2018,23.0,22.8,22.6,23.0
  2019,,23.1,22.9,23.3
  2020,,23.5,23.2,23.7
  2021,,23.8,23.6,24.0
  2022,,24.1,23.9,24.3
  2023,,24.4,24.1,24.6
  2024,,24.7,24.5,24.9
  2025,,25.0,24.8,25.2
  2026,,25.3,25.0,25.5
  2027,,25.5,25.3,25.7
  2028,,25.8,25.5,26.0
  2029,,26.0,25.7,26.3
  2030,,26.2,26.0,26.5
  2031,,26.4,26.2,26.7
  2032,,26.7,26.4,27.0
  2033,,26.9,26.6,27.1
  2034,,27.1,26.8,27.3
  2035,,27.3,27.0,27.4
  2036,,27.4,27.2,27.6
  2037,,27.6,27.4,27.8
  2038,,27.8,27.5,28.0
  2039,,27.9,27.7,28.1
  2040,,28.1,27.8,28.3
  2041,,28.2,28.0,28.4
  2042,,28.4,28.2,28.6
  2043,,28.5,28.3,28.7
  2044,,28.6,28.5,28.9
  2045,,28.8,28.6,29.0
  2046,,28.9,28.7,29.1
  2047,,29.0,28.8,29.2
  2048,,29.1,28.9,29.3
  2049,,29.2,29.0,29.4
  2050,,29.3,29.0,29.5