By Efraim Berkovich and Jagadeesh Gokhale
On May 16, 2019, PWBM participated in a session at the National Tax Association (NTA) 49th Annual Spring Symposium. The session compared overlapping-generations (OLG) models from Penn Wharton Budget Model (PWBM), the Congressional Budget Office (CBO),1 the U.S. Senate Joint Committee on Taxation (JCT),2 EY QUEST,3 Diamond-Zodrow (DZ)4 from the Rice University, Texas, Overlapping Generations USA (OGUSA)5 and the Global Gaidar Model (GGM).6
This NTA session constituted the second round of the OLG modeling meetings organized by the CBO. The goal of these meetings is to learn about the implications of alternative modeling choices for projecting U.S. economic outcomes under pre-specified changes in U.S. fiscal policy. CBO’s presentation is available here. All of the models were executed under very simplified policy and economic assumptions to ensure comparability across models. Besides only focusing on a simple benefit cut, the analysis only reported percent changes in key macroeconomic variables (e.g., percent changes in GDP) rather than levels (e.g., actual GDP) and budgetary impacts (e.g., changes in program costs), consistent with an actual score.
Projections differ across models because of alternative ways in which they are constructed and calibrated, especially on the sensitivity of individuals’ choices of how much to work and earn and how much to consume or save over time. PWBM’s projections of macroeconomic variables turned out to be quite close to the CBO’s results in key macroeconomic variables.
Each modeling group reports how the economy’s path changes under the alternative policy of a preannounced Old-Age and Survivors Insurance (OASI) benefit cut of one-third beginning in 2031. This simplified and stylized policy change was chosen to fit within the capabilities of all the models. PWBM can model highly complex Social Security reform proposals. In fact, PWBM has modeled the Social Security 2100 Act and options for return Social Security to financial balance. In addition, our Social Security simulator shows the effects of 648 policy combinations.
The model comparison metric for each macroeconomic outcome variable is the change in the variable’s time path under the new policy relative to the path projected under current policy. Although the results presented at the symposium were limited to changes in variables, models that are supported by a microsimulation, such as PWBM’s and CBO’s, can also analyze levels of economic indicators. A critical assumption underlying outcome differences across models is how open the U.S. economy is to international capital flows.
Comparing Model Projections
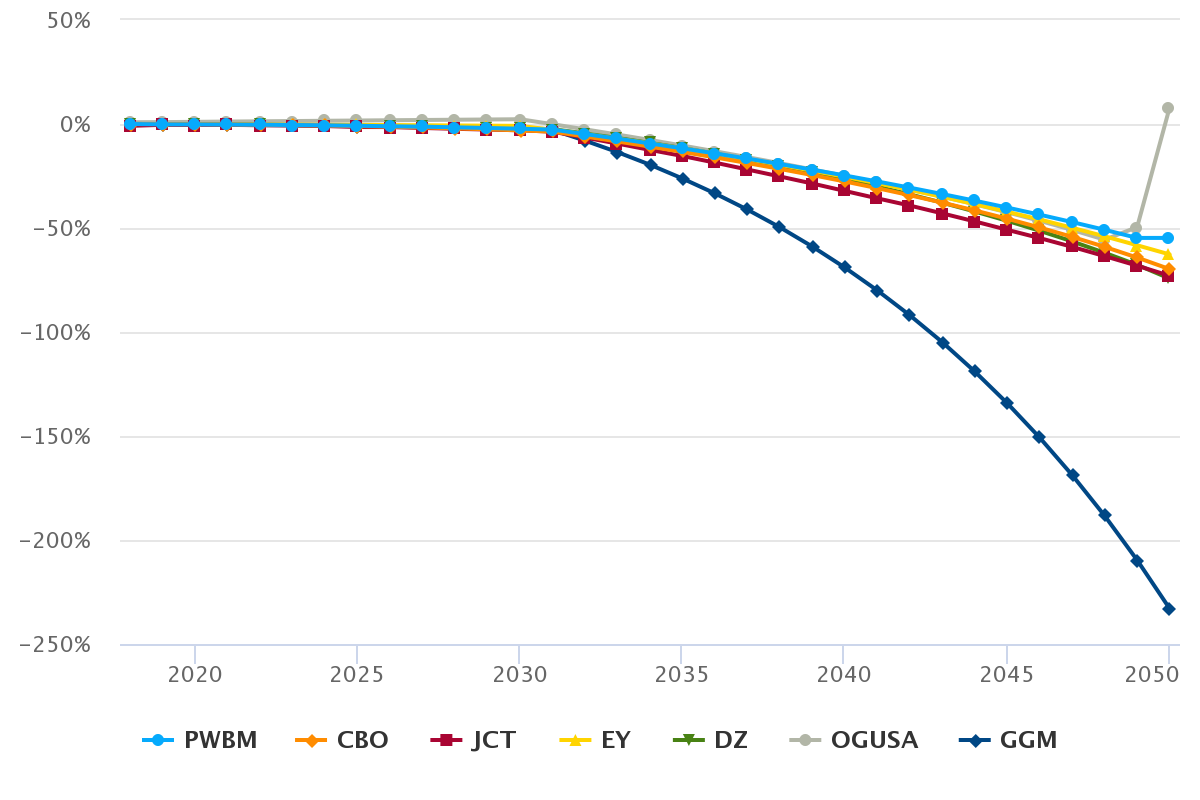
Figure 1 shows that all except one of the models show that the OASI benefit cut in 2031 reduces the debt-to-GDP ratio by between 55-75 percentage points approaching mid-century. Under PWBM’s model (light blue line in Figure 1), this ratio declines by 55 percentage points (from 285 percent to 230 percent) whereas the decline projected by the CBO (orange line in Figure 1) is 59 percentage points.
Figure 1: Change in the Debt-to-GDP Ratio
Projections of growth in the capital stock differ significantly across models are seen in Figure 2. The differences mostly arise from alternative international capital flows assumed by different models. The OASI cut policy induces model individuals to consume less and work more, thus generating additional national saving. The more closed the economy is to foreign capital flows, the greater the share of increased saving that is retained within the United States. PWBM assumes that foreigners purchase 40 percent of new debt issued by the federal government each year and provide 40 percent of capital flows needed to equilibrate U.S. interest rates to the world rate. The CBO’s openness assumption is similar to PWBM’s as reflected in similar projection outcomes for growth in the U.S. capital stock.
Figure 2: Change in Capital Stocks

As seen in Figure 3, different models assume different sensitivities of labor supply by individuals in response to the OASI cut policy. In addition, higher retention of capital within the economy increases wages and thereby elicits a stronger labor supply response to the OASI cut policy. PWBM’s projection of the labor supply response is in the middle of the range of model outcomes. It is smaller than that of the CBO, especially over the long term.
Figure 3: Change in Labor Supply

Output growth projections follow from labor and capital growth. More capital and a stronger labor response make for a larger increase in output over time in response to the OASI benefit cut policy. PWBM’s projected output growth is less than that of CBO because of our lower projections of growth in the capital stock and labor supply.
Figure 4: Change in GDP

The NTA session brought forth three critical conclusions:
According to all model runs, under current fiscal policies, the U.S. economy appears to be fiscally unsustainable primarily because of rapid increases in national debt projected within the models.
Even significant policy adjustments such as an OASI benefit cut by one third after 2031 still leaves the U.S. with sizable debt relative to GDP by mid-century.
Projections of how such a policy alters the paths of key macroeconomic variables agree on the direction but not on the magnitudes of outcomes.
-
Congressional Budget Office, “An Overview of CBO’s Life-Cycle Growth Model” (February 2019), https://www.cbo.gov/publication/54985 and Shinichi Nishiyama and Felix Reichling, The Costs to Different Generations of Policies That Close the Fiscal Gap, Working Paper 2015-10 (Congressional Budget Office, December 2015), https://www.cbo.gov/publication/51097. ↩
-
Rachel Moore and Brandon Pecoraro, “Modeling the Internal Revenue Code in a Heterogeneous-Agent Framework: An Application to TCJA” (draft, May 2019), https://doi.org/10.2139/ssrn.3367192 and Rachel Moore and Brandon Pecoraro, “Macroeconomic Implications of Modeling the Internal Revenue Code in a Heterogeneous-Agent Framework” (draft, December 2018), https://doi.org/10.2139/ssrn.3193142 ↩
-
EY QUEST Model, developed by Brandon Pizzola, Robert Carroll, and James Mackie: EY, Analyzing the Macroeconomic Impacts of the Tax Cuts and Jobs Act on the US Economy and Key Industries (2018), https://tinyurl.com/y4fpbjgf (PDF, 2.9 MB). ↩
-
Diamond-Zodrow Model: George R. Zodrow and John W. Diamond, “Dynamic Overlapping Generations Computable General Equilibrium Models and the Analysis of Tax Policy: The Diamond-Zodrow Model,” in Peter B. Dixon and Dale W. Jorgensen, eds., Handbook of Computable General Equilibrium Modeling (Elsevier, 2013), vol. 1, pp. 743–813, https://doi.org/10.1016/B978-0-444-59568-3.00011-0. ↩
-
OG-USA Model: Richard W. Evans and Jason DeBacker, “OG-USA: Documentation for the Large-Scale Dynamic General Equilibrium Overlapping Generations Model for U.S. Policy Analysis” (November 2018), https://tinyurl.com/y694ljom (PDF, 1.6 MB). ↩
-
Global Gaidar Model, developed by Seth Benzell, Maria Kasakova, Laurence Kotlikoff, Guillermo Lagarda, Kristina Nesterova, Victor Ye, and Andrey Zubarev: Seth G. Benzell, Laurence J. Kotlikoff, and Guillermo LaGarda, Simulating Business Cash Flow Taxation: An Illustration Based on the “Better Way” Corporate Tax Reform, Working Paper 23675 (National Bureau of Economic Research, August 2017), https://www.nber.org/papers/w23675. ↩
    Year,PWBM,CBO,JCT,EY,DZ,OGUSA,GGM
    2018,0,0,-0.0090,-0.002,0.000683153,0.0085451,-0.0018
    2019,-0.001817296,-0.00043586,-0.0038,-0.002,-0.000883303,0.009088321,-0.0025
    2020,-0.002107175,-0.00114846,-0.0049,-0.002,-0.001767173,0.010364061,-0.0033
    2021,-0.002727837,-0.00218941,-0.0043,-0.002,-0.002719637,0.011699796,-0.0042
    2022,-0.003502271,-0.00355514,-0.0058,-0.003,-0.003791984,0.012981108,-0.0053
    2023,-0.004812542,-0.00532386,-0.0066,-0.003,-0.005037284,0.014225625,-0.0065
    2024,-0.006338599,-0.00749107,-0.0098,-0.004,-0.006488249,0.01552127,-0.0081
    2025,-0.008340937,-0.01008102,-0.0144,-0.004,-0.008171496,0.016864144,-0.0098
    2026,-0.010960611,-0.01313484,-0.0148,-0.005,-0.01011223,0.018081362,-0.0118
    2027,-0.012795497,-0.01669578,-0.0191,-0.006,-0.012336492,0.019292072,-0.0142
    2028,-0.015856299,-0.02079704,-0.0231,-0.007,-0.014872398,0.020500215,-0.017
    2029,-0.019122668,-0.02546013,-0.0268,-0.008,-0.017751121,0.021719239,-0.0202
    2030,-0.0227193,-0.03074516,-0.0302,-0.009,-0.021007152,0.022994115,-0.024
    2031,-0.026840366,-0.03669265,-0.0370,-0.028,-0.024679218,-0.000989848,-0.0287
    2032,-0.048283272,-0.06004975,-0.0653,-0.049,-0.045481772,-0.025565117,-0.08
    2033,-0.070433207,-0.08403,-0.0943,-0.071,-0.067582047,-0.05079439,-0.1354
    2034,-0.093398143,-0.10870346,-0.1246,-0.093,-0.091053384,-0.076796932,-0.1958
    2035,-0.117051417,-0.1341507,-0.1539,-0.117,-0.115974303,-0.103585966,-0.2621
    2036,-0.141315,-0.16045472,-0.1858,-0.143,-0.142431351,-0.131128417,-0.3337
    2037,-0.166435919,-0.18771103,-0.2188,-0.169,-0.170519426,-0.15941696,-0.4117
    2038,-0.192649581,-0.21602616,-0.2523,-0.196,-0.200342818,-0.18850191,-0.4967
    2039,-0.219737696,-0.24551513,-0.2862,-0.225,-0.232016977,-0.21849496,-0.5894
    2040,-0.247476964,-0.27631256,-0.3219,-0.254,-0.265517259,-0.249445713,-0.6903
    2041,-0.276241592,-0.3085553,-0.3574,-0.285,-0.300973947,-0.281493933,-0.8002
    2042,-0.306012178,-0.34239975,-0.3921,-0.317,-0.338526324,-0.314778028,-0.9195
    2043,-0.336773047,-0.37801987,-0.4297,-0.350,-0.378342343,-0.34952309,-1.0489
    2044,-0.368645423,-0.41561233,-0.4684,-0.385,-0.420612634,-0.386052148,-1.1899
    2045,-0.401769824,-0.45540131,-0.5087,-0.422,-0.465554121,-0.424585918,-1.3423
    2046,-0.435956657,-0.49763611,-0.5485,-0.459,-0.513416385,-0.46550356,-1.5079
    2047,-0.471560584,-0.54260589,-0.5907,-0.499,-0.564475053,-0.509220137,-1.6879
    2048,-0.508663259,-0.59064255,-0.6353,-0.540,-0.619222335,-0.556311086,-1.8835
    2049,-0.547677816,-0.64213196,-0.6810,-0.583,-0.677285891,-0.495761489,-2.0966
    2050,-0.547677816,-0.69752441,-0.7299,-0.627,-0.743092776,0.078701851,-2.3295
    Year,PWBM,CBO,JCT,EY,DZ,OGUSA,GGM
    2018,0,0.00405095,0.0000,-0.001787746,-0.001676639,-0.002241398,0.021384929
    2019,1.88675E-11,0.006651896,-0.0006,-0.001120728,0.000750919,-0.000819137,0.020916335
    2020,0.004760008,0.009320146,-0.0011,-0.000481299,0.002283607,1.33619E-05,0.019569472
    2021,0.008294739,0.01189044,-0.0012,0.000184092,0.003954317,0.000877794,0.019230769
    2022,0.011825338,0.01452677,-0.0010,0.000889403,0.005658137,0.001748805,0.018903592
    2023,0.015569176,0.017231348,-0.0006,0.00160248,0.007392626,0.002621852,0.018587361
    2024,0.019330572,0.020013839,0.0001,0.002347319,0.009160192,0.003496164,0.017351598
    2025,0.02324485,0.022873532,0.0010,0.003118522,0.010967842,0.004406511,0.016157989
    2026,0.027442537,0.025818622,0.0020,0.003929701,0.012824493,0.005340402,0.01590106
    2027,0.030602276,0.028845076,0.0031,0.004648971,0.014740227,0.006230011,0.015638575
    2028,0.034708225,0.031954597,0.0041,0.00549514,0.01672643,0.007055676,0.014517506
    2029,0.03870731,0.035223786,0.0052,0.006382183,0.018795716,0.007787284,0.014285714
    2030,0.042744258,0.038632821,0.0064,0.007290972,0.020961968,0.00836727,0.014107884
    2031,0.047065478,0.042311359,0.0076,0.008282086,0.023241344,0.012746892,0.013114754
    2032,0.05067827,0.046113609,0.0088,0.011613781,0.025899653,0.017202954,0.012135922
    2033,0.054242268,0.050093033,0.0101,0.015095718,0.028746684,0.021744069,0.011990408
    2034,0.058029931,0.054261347,0.0115,0.018689988,0.031792839,0.026408761,0.011049724
    2035,0.061805295,0.058623584,0.0128,0.02239747,0.035045012,0.03119347,0.010140406
    2036,0.065599308,0.063205823,0.0141,0.026289702,0.038513605,0.036068303,0.010802469
    2037,0.069461654,0.068024218,0.0154,0.030263876,0.042212264,0.041016662,0.009916095
    2038,0.073644444,0.073111477,0.0168,0.034395888,0.046157964,0.046044842,0.009803922
    2039,0.078024442,0.078489045,0.0181,0.038654256,0.05037115,0.051194397,0.009694258
    2040,0.08236624,0.084188681,0.0195,0.043037668,0.054875756,0.056475238,0.0095518
    2041,0.08692423,0.090245672,0.0209,0.047537825,0.05970081,0.061942074,0.010130246
    2042,0.091672315,0.096730306,0.0225,0.052165781,0.064876824,0.067648493,0.00997151
    2043,0.096602544,0.103630805,0.0241,0.056937718,0.070458834,0.073669158,0.009810792
    2044,0.101752576,0.111067707,0.0260,0.061868229,0.076510863,0.080132293,0.010337698
    2045,0.107144716,0.119099561,0.0281,0.067068447,0.08310441,0.087133537,0.010847458
    2046,0.112767746,0.127813583,0.0305,0.072366943,0.090329055,0.094821657,0.010666667
    2047,0.118691542,0.137322508,0.0330,0.077984189,0.098252191,0.103382713,0.011147541
    2048,0.124937814,0.147803902,0.0357,0.083842359,0.107206944,0.113064784,0.012250161
    2049,0.131517969,0.159420973,0.0382,0.089952808,0.115940747,0.104514092,0.012674271
    2050,0.132203469,0.172356152,0.0401,0.096334345,0.126792532,0.011650116,0.013707165
    Year,PWBM,CBO,JCT,EY,DZ,OGUSA,GGM
    2018,0,0.005788074,0.0185,0.005419556,0.002214848,-0.015433091,0.020396714
    2019,0.003300599,0.005891166,0.0128,0.005190235,0.002517937,-0.015438785,0.020059878
    2020,0.00306546,0.005989089,0.0115,0.004939059,0.002689777,-0.015518887,0.018804052
    2021,0.002823498,0.005829442,0.0070,0.004671772,0.002878006,-0.015711889,0.017865391
    2022,0.002372761,0.00569545,0.0069,0.004381967,0.003029483,-0.015928107,0.017051639
    2023,0.002277175,0.005582555,0.0050,0.004071729,0.003154707,-0.016105594,0.016781878
    2024,0.002046212,0.005499409,0.0076,0.003746093,0.003260289,-0.016378319,0.015908661
    2025,0.001756763,0.00543827,0.0116,0.003402399,0.003351135,-0.01655981,0.01592699
    2026,0.001782561,0.005395041,0.0061,0.0030241,0.003431241,-0.016868907,0.015742941
    2027,0.001005832,0.005357685,0.0085,0.002626689,0.003504382,-0.017162663,0.014735282
    2028,0.000913528,0.005320343,0.0089,0.002210123,0.003573931,-0.017487029,0.013742513
    2029,0.000717638,0.005358903,0.0083,0.001762997,0.003643184,-0.017851434,0.013592414
    2030,0.000490324,0.005440003,0.0065,0.001283561,0.003715752,-0.018281935,0.012875057
    2031,0.000158383,0.00569379,0.0104,0.000362267,0.00379533,-0.018180167,0.011949244
    2032,8.48403E-05,0.005825642,0.0096,0.000183934,0.003938222,-0.01808098,0.012380684
    2033,-3.98934E-06,0.005970681,0.0086,4.13233E-05,0.004123837,-0.01797458,0.011478385
    2034,-5.60496E-05,0.006142141,0.0083,-8.69228E-05,0.004353565,-0.01784265,0.011362069
    2035,-4.52806E-05,0.006328799,0.0057,-0.000217797,0.004628938,-0.0176874,0.011709476
    2036,-3.38061E-06,0.00654568,0.0063,-0.000308825,0.004952256,-0.017507814,0.01155225
    2037,-4.60597E-05,0.006786296,0.0073,-0.000376911,0.005326564,-0.017293693,0.012130406
    2038,-6.53263E-05,0.007061587,0.0073,-0.000427946,0.005755704,-0.017039913,0.012175814
    2039,-2.80706E-05,0.007364642,0.0068,-0.000455476,0.006244703,-0.016737433,0.012211164
    2040,9.90958E-05,0.007706468,0.0078,-0.000458921,0.006799014,-0.016377656,0.012519702
    2041,0.000253458,0.00809018,0.0070,-0.000430188,0.007425465,-0.0159399,0.013027978
    2042,0.0003369,0.00855374,0.0044,-0.000366436,0.008134996,-0.015406439,0.013031822
    2043,0.000610215,0.009018946,0.0060,-0.000265028,0.008939577,-0.014745798,0.013505572
    2044,0.000755459,0.009573249,0.0072,-0.000123451,0.009853353,-0.013917398,0.014623072
    2045,0.00094788,0.010202222,0.0102,5.6984E-05,0.010892797,-0.012881752,0.01503885
    2046,0.00116785,0.010913956,0.0091,0.000289935,0.012078916,-0.011573927,0.016280864
    2047,0.001354149,0.011726469,0.0108,0.000566169,0.013437927,-0.009903261,0.016840025
    2048,0.001636265,0.012713531,0.0143,0.000896432,0.015013879,-0.007747537,0.017821855
    2049,0.002203082,0.013888583,0.0146,0.001282306,0.0167764,-0.007804256,0.018765268
    2050,0.002130705,0.01523904,0.0177,0.001727061,0.018550003,-0.020487349,0.020467652
    Year,PWBM,CBO,JCT,EY,DZ,OGUSA,GGM
    2018,0,0.00518243,0.0118,0.00178,-0.001311387,-0.010836548,0.020231214
    2019,0.00220664,0.006156152,0.0078,0.00195,0.000487247,-0.010347457,0.02
    2020,0.003728063,0.007148579,0.0068,0.00206,0.001125504,-0.010111243,0.019774011
    2021,0.004793765,0.007937249,0.0039,0.00218,0.001611022,-0.009937962,0.019589552
    2022,0.00576798,0.008763904,0.0039,0.00234,0.001987641,-0.00977786,0.019408503
    2023,0.006936996,0.009626338,0.0029,0.00246,0.002309746,-0.009591985,0.020164986
    2024,0.008121617,0.010533368,0.0049,0.00260,0.002600298,-0.009468266,0.02
    2025,0.009322092,0.011479496,0.0079,0.00274,0.002871181,-0.009272691,0.020739405
    2026,0.010685021,0.0124651,0.0049,0.00295,0.003129509,-0.009152836,0.02066487
    2027,0.01145042,0.013480435,0.0069,0.00305,0.003380211,-0.009038546,0.021505376
    2028,0.012757321,0.014522183,0.0076,0.00317,0.003627451,-0.008966667,0.021428571
    2029,0.014006441,0.015666144,0.0078,0.00329,0.003875088,-0.00895372,0.022261799
    2030,0.015253079,0.016884006,0.0072,0.00340,0.004126476,-0.009036558,0.022182786
    2031,0.016592181,0.018304848,0.0103,0.00333,0.004384748,-0.007465437,0.02214349
    2032,0.017757466,0.019684699,0.0104,0.00446,0.004831878,-0.005873898,0.022988506
    2033,0.018886098,0.021130706,0.0103,0.00565,0.005347839,-0.004252743,0.02292769
    2034,0.02009413,0.022654742,0.0108,0.00688,0.00593122,-0.002576973,0.023746702
    2035,0.021304984,0.024250998,0.0098,0.00815,0.006580561,-0.000849506,0.025438596
    2036,0.022555036,0.025937735,0.0108,0.00947,0.00729663,0.000919975,0.025327511
    2037,0.023807234,0.027715471,0.0121,0.01084,0.008081569,0.002732483,0.026956522
    2038,0.025151098,0.029602076,0.0127,0.01224,0.008938677,0.004593466,0.027657736
    2039,0.026596485,0.031598953,0.0130,0.01369,0.009872495,0.006522788,0.029184549
    2040,0.028033287,0.033724016,0.0143,0.01517,0.010888096,0.008529322,0.029812606
    2041,0.029572817,0.035989868,0.0145,0.01669,0.011992725,0.010644925,0.031223629
    2042,0.03117581,0.038443715,0.0136,0.01824,0.013179531,0.012898972,0.031746032
    2043,0.03284458,0.041028395,0.0154,0.01985,0.014463586,0.015336876,0.033912324
    2044,0.034571778,0.04384105,0.0171,0.02150,0.015861669,0.018027645,0.035159444
    2045,0.036399233,0.046888956,0.0200,0.02321,0.017390733,0.021028451,0.036319613
    2046,0.038291337,0.05020407,0.0204,0.02498,0.019069783,0.02443073,0.037450199
    2047,0.0402765,0.053832448,0.0227,0.02681,0.020901434,0.028355029,0.040125885
    2048,0.042382769,0.057878422,0.0263,0.02871,0.023074542,0.032962852,0.04189294
    2049,0.04473137,0.062399474,0.0277,0.03068,0.024650485,0.030140669,0.044376435
    2050,0.044898335,0.067440117,0.0306,0.03273,0.02989402,-0.009351013,0.046792453