This analysis was presented in a Wharton LinkedIn Live event on Tuesday, May 5th. Watch a video recording of the event.
Updated simulator on June 23, 2020 to incorporate: (i) the most recent data; (ii) shifting the projection window from June 15 – August 9 to June 22 – August 24; (iii) further model improvements including the incorporation of additional data sources tracking anonymized cell phone location.
Introduction
In response to the coronavirus pandemic, at one point almost every U.S. state had imposed lockdown orders to stem the spread of the virus. Some states have begun to relax these orders, easing stay at home orders and restrictions on nonessential businesses. Many other states are considering easing restrictions as well.
The interactive tool presented below uses an epidemiological framework along with empirical estimates to simulate the health and economic effects of easing state lockdown policies. Users specify both a “policy” level and “behavior” level. The policy level represents the extent to which states reopen and has three settings:
Baseline Policy: Each state maintains its current restrictions as of June 21.
Lift Stay-At-Home Orders: As of June 22, states lift all remaining shelter-in-place orders.
Full Reopening: As of June 22, states lift stay-at-home orders as well as emergency declarations, school closures, and restrictions on the operation of businesses and restaurants.
The behavior lever represents individuals’ decisions on whether to continue social distancing practices. This behavior level has two settings:
Baseline Behavior: Each individual maintains their current social distancing practices.
Reduced Distancing: Individuals relax their social distancing efforts, returning fully to pre-pandemic behavior by the end of December 2020.
By default, the simulator shows national forecasts for total reported coronavirus cases, cumulative deaths due to coronavirus, year-over-year percent change in GDP and change jobs during the previous 7 days. See FAQ below for precise definitions. Clicking on a state shows forecasts of these same variables specific to that state. Unclick that state to return to the national forecast.
FAQ
- What outcomes does the model track?
- Cases: Cumulative reported coronavirus cases, including those occurring before the start of the simulation on June 22.
- Deaths: Cumulative deaths due to coronavirus, including those occurring before the start of the simulation on June 11.
- GDP: Year-over-year GDP, which equals daily GDP compared to one year prior. So, for example, a value of -10% on June 22 for a particular state means that GDP as of June 22, 2020 is 10 percent lower compared to GDP on June 22, 2019.
- Employment: Total change in employment during the previous seven days. This measure is comparable to how “new jobless claims” are reported by the Department of Labor except our measure: (i) nets out new jobs to get a comprehensive change in employment; (ii) we show a rolling 7-day window on each day (not just on Thursdays of each week) to indicate changes in jobs during the previous 7 days. To get cumulative job changes since June 22, download the Excel spreadsheet.
- I would like to see national and state outcomes compared across the various scenarios but where job changes are shown as cumulative since June 22. Can you summarize?
- How often will the simulator be updated? And why do projections only go two months out?
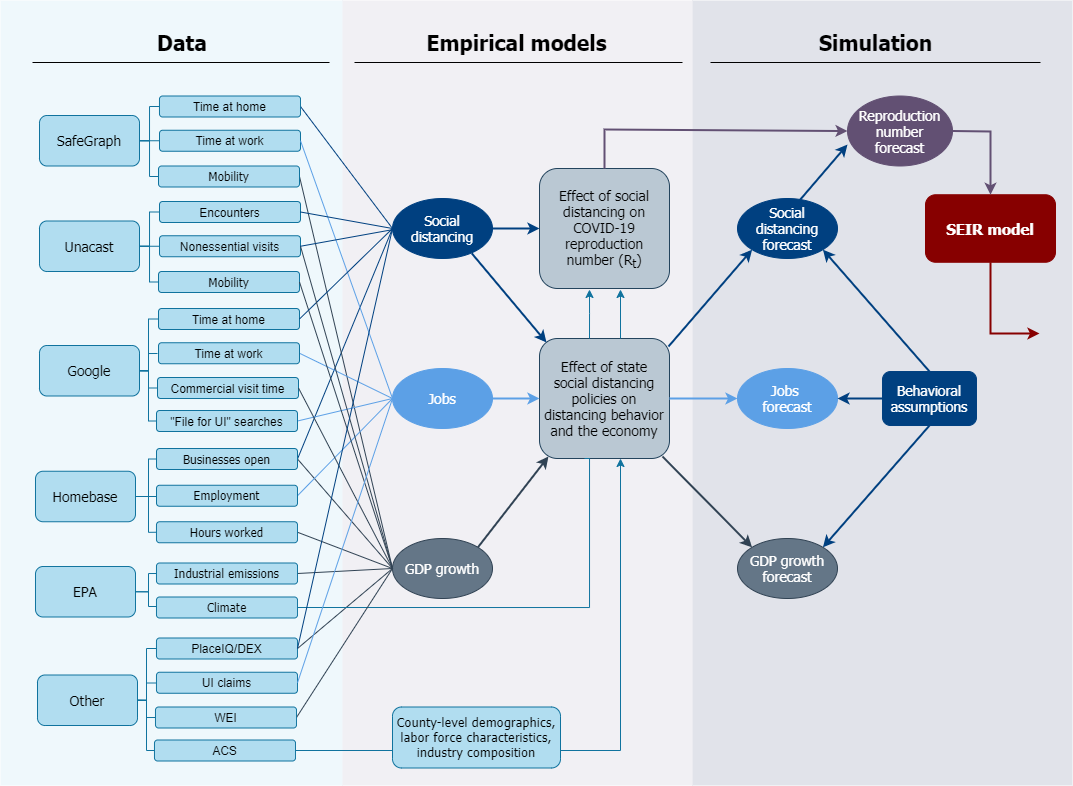
- What models inform the simulator?
- Our model estimates daily measures of social distancing, GDP growth, and changes in employment.
- Our model generates empirical estimates of the effects of six social distancing policies: emergency declarations, stay-at-home orders, school closures, restaurant restrictions, non-essential business restrictions, and other business closures.
- Finally, an epidemiological model is used to estimate state viral reproduction rates, which are in turn used to forecast cases and deaths for each state.
- How does the estimation of daily and weekly data work?
- How does the empirical component of the simulator work?
- How does the epidemiological component of the simulator work?
- What are the most important parameters in the model? How sensitive is the model to these parameters?
- What data feed into the simulator?
- The American Community Survey
- O*NET
- Occupational Employment Statistics from the Bureau of Labor Statistics
- Unemployment Insurance claims from the Department of Labor
- The New York Times’ coronavirus cases data
- Johns Hopkins University Center for Systems Science and Engineering COVID-19 Dashboard
- The COVID Tracking Project
- Homebase microdata
- Unacast Scoreboard
- Google Trends
- NOAA Local Climatological Data
- Data on work arrangements from Dingell and Neiman (April 2020)
- Data on state social distancing policies from Fullman et al. (April 2020)
- Data on economic activity from Lewis, Mertens, and Stock (April, 2020)
| Projection Type | Policy Scenario | Behavior Scenario | Cumulative Cases | Cumulative Deaths | Change in Net Jobs (millions) over forecast window | Year-over-Year GDP (% change) |
|---|---|---|---|---|---|---|
| Baseline (levels) | Baseline Policy | Baseline Behavior | ||||
| Difference from baseline* | Lift Remaining Stay-At-Home Orders | Baseline Behavior | ||||
| Full Reopening | Baseline Behavior | |||||
| Baseline Policy | Reduced Social Distancing | |||||
| Lift Remaining Stay-At-Home Orders | Reduced Social Distancing | |||||
| Full Reopening | Reduced Social Distancing |
* Difference from baseline calculated by taking the level under the scenario and subtracting the baseline level.
The model estimates the effects of the six social distancing policies listed above on the economy and the virus’s spread using a differences-in-differences framework. For each of the six policies, this identification strategy compares states that do and don’t implement the policy and then compares these differences across time. Because state implementation of policies is not random, we adjust for observable differences at the county level such as the number of confirmed cases, population, density, population age, public transit, and labor force and industry characteristics.
We also estimate the relationship between physical encounters and the virus's rate of reproduction R, controlling for weather and county characteristics like population density, demographics, and industry composition. Our results show that since the start of the pandemic, the relationship between physical encounters (as measured by multiple sources of cell phone location data) and Coronavirus transmission has weakened. As Americans have began leaving their homes in recent weeks, the number of interpersonal encounters has risen, but the nature of these encounters has fundamentally changed. Best practices like mask-wearing, hand-sanitization, and avoiding crowded indoor gatherings are more common today.
Our model shows that lifting restrictions alone will lead to more encounters between people, which in turn has positive economic effects. But whether this increased activity translates into meaningful Coronavirus transmission will depend on whether personal habits deteriorate. PWBM does not take a stand on this issue. We instead allow users to view under two extremes: current distancing practices are maintained ("Baseline"), or people revert to their pre-pandemic behavior over time. Critically, our analysis demonstrates the nonlinear effect of combining both that lifting restrictions in combination with relaxed distancing efforts would lead to more cases and deaths.
The epidemiological component of the model is a “SIR+” model. Individuals in this model fall into one of five categories: Susceptible, Exposed, Symptomatic (Infected), Asymptomatic (Infected), or Resistant, which includes those who have died. A set of differential equations governs the transitions between these categories.
Some parameters of the model are biological and are set based on clinical evidence. Given these basic features of the disease, we estimate a time-varying R—the virus’s rate of reproduction—for each state based on reported cases and deaths. Differences in R across states and over time reflect the extent and effectiveness of social distancing.
Then, to simulate the effects of different policies, we estimate the empirical relationship between social distancing and R. Policy changes and estimates from the empirical component of the simulator are translated into a forecast of R. The calibrated SIR+ model and policy-adjusted values of R are used to make the final epidemiological forecasts for each state.
Like all epidemiological models, our model is sensitive to estimates of the virus’s rate of reproduction, R—the average number of people that someone with the virus will infect. A value of R greater than one implies uncontrolled, exponential growth in cases and deaths. For some borderline states a small increase in the rate could raise the infection rate above one. States with little testing capacity need to be especially wary of this sensitivity, as they face greater uncertainty regarding reproduction rates.
The epidemiological model also includes a number of other assumed parameters including the share of unascertained (asymptomatic or untested) cases, the virus’s incubation period, and the case fatality ratio. Because so little is known about the novel coronavirus, the true values of parameters are highly uncertain. We base our assumptions on a mix of preliminary clinical evidence and statistical model-fitting procedures, and will update our estimates as virologists’ understanding of COVID-19 improves and as more data becomes available.
  State,PolicyScenario,BehaviorScenario,StartDate,EndDate,Jobs.Cumulative
  Alabama,Baseline,Baseline,6/22/2020,8/23/2020,0.125934677
  Alaska,Baseline,Baseline,6/22/2020,8/23/2020,0.025567408
  Arizona,Baseline,Baseline,6/22/2020,8/23/2020,0.021450175
  Arkansas,Baseline,Baseline,6/22/2020,8/23/2020,0.037642055
  California,Baseline,Baseline,6/22/2020,8/23/2020,0.19053054
  Colorado,Baseline,Baseline,6/22/2020,8/23/2020,0.037679646
  Connecticut,Baseline,Baseline,6/22/2020,8/23/2020,0.084104373
  Delaware,Baseline,Baseline,6/22/2020,8/23/2020,-0.026614103
  District of Columbia,Baseline,Baseline,6/22/2020,8/23/2020,-0.040164273
  Florida,Baseline,Baseline,6/22/2020,8/23/2020,0.230555754
  Georgia,Baseline,Baseline,6/22/2020,8/23/2020,0.087003969
  Hawaii,Baseline,Baseline,6/22/2020,8/23/2020,0.003887392
  Idaho,Baseline,Baseline,6/22/2020,8/23/2020,-0.021379538
  Illinois,Baseline,Baseline,6/22/2020,8/23/2020,0.073212009
  Indiana,Baseline,Baseline,6/22/2020,8/23/2020,0.09286903
  Iowa,Baseline,Baseline,6/22/2020,8/23/2020,0.268928861
  Kansas,Baseline,Baseline,6/22/2020,8/23/2020,0.098604979
  Kentucky,Baseline,Baseline,6/22/2020,8/23/2020,0.298341215
  Louisiana,Baseline,Baseline,6/22/2020,8/23/2020,0.123790885
  Maine,Baseline,Baseline,6/22/2020,8/23/2020,0.015556364
  Maryland,Baseline,Baseline,6/22/2020,8/23/2020,0.163884814
  Massachusetts,Baseline,Baseline,6/22/2020,8/23/2020,0.31783925
  Michigan,Baseline,Baseline,6/22/2020,8/23/2020,0.070705555
  Minnesota,Baseline,Baseline,6/22/2020,8/23/2020,0.07992214
  Mississippi,Baseline,Baseline,6/22/2020,8/23/2020,0.020743076
  Missouri,Baseline,Baseline,6/22/2020,8/23/2020,0.327338405
  Montana,Baseline,Baseline,6/22/2020,8/23/2020,0.037766845
  Nebraska,Baseline,Baseline,6/22/2020,8/23/2020,0.112511096
  Nevada,Baseline,Baseline,6/22/2020,8/23/2020,0.02448742
  New Hampshire,Baseline,Baseline,6/22/2020,8/23/2020,-0.016976631
  New Jersey,Baseline,Baseline,6/22/2020,8/23/2020,-0.040362574
  New Mexico,Baseline,Baseline,6/22/2020,8/23/2020,-0.018249953
  New York,Baseline,Baseline,6/22/2020,8/23/2020,0.006853333
  North Carolina,Baseline,Baseline,6/22/2020,8/23/2020,0.101936426
  North Dakota,Baseline,Baseline,6/22/2020,8/23/2020,0.019103512
  Ohio,Baseline,Baseline,6/22/2020,8/23/2020,0.116985929
  Oklahoma,Baseline,Baseline,6/22/2020,8/23/2020,-0.01665288
  Oregon,Baseline,Baseline,6/22/2020,8/23/2020,0.076218222
  Pennsylvania,Baseline,Baseline,6/22/2020,8/23/2020,0.097978046
  Rhode Island,Baseline,Baseline,6/22/2020,8/23/2020,0.014108382
  South Carolina,Baseline,Baseline,6/22/2020,8/23/2020,0.082904225
  South Dakota,Baseline,Baseline,6/22/2020,8/23/2020,0.049031096
  Tennessee,Baseline,Baseline,6/22/2020,8/23/2020,0.066716372
  Texas,Baseline,Baseline,6/22/2020,8/23/2020,0.144157629
  United States,Baseline,Baseline,6/22/2020,8/23/2020,4.325080965
  Utah,Baseline,Baseline,6/22/2020,8/23/2020,0.164275828
  Vermont,Baseline,Baseline,6/22/2020,8/23/2020,0.037262788
  Virginia,Baseline,Baseline,6/22/2020,8/23/2020,0.145672078
  Washington,Baseline,Baseline,6/22/2020,8/23/2020,0.088487627
  West Virginia,Baseline,Baseline,6/22/2020,8/23/2020,7.48E-04
  Wisconsin,Baseline,Baseline,6/22/2020,8/23/2020,0.280776673
  Wyoming,Baseline,Baseline,6/22/2020,8/23/2020,0.041406789
  Alabama,Baseline,Slow,6/22/2020,8/23/2020,0.136062621
  Alaska,Baseline,Slow,6/22/2020,8/23/2020,0.028570291
  Arizona,Baseline,Slow,6/22/2020,8/23/2020,0.069207209
  Arkansas,Baseline,Slow,6/22/2020,8/23/2020,0.04780324
  California,Baseline,Slow,6/22/2020,8/23/2020,0.19053054
  Colorado,Baseline,Slow,6/22/2020,8/23/2020,0.037679646
  Connecticut,Baseline,Slow,6/22/2020,8/23/2020,0.133166759
  Delaware,Baseline,Slow,6/22/2020,8/23/2020,-0.026614103
  District of Columbia,Baseline,Slow,6/22/2020,8/23/2020,-0.040164273
  Florida,Baseline,Slow,6/22/2020,8/23/2020,0.230555754
  Georgia,Baseline,Slow,6/22/2020,8/23/2020,0.087003969
  Hawaii,Baseline,Slow,6/22/2020,8/23/2020,0.003887392
  Idaho,Baseline,Slow,6/22/2020,8/23/2020,-0.021598274
  Illinois,Baseline,Slow,6/22/2020,8/23/2020,0.073212009
  Indiana,Baseline,Slow,6/22/2020,8/23/2020,0.09286903
  Iowa,Baseline,Slow,6/22/2020,8/23/2020,0.287206582
  Kansas,Baseline,Slow,6/22/2020,8/23/2020,0.115731889
  Kentucky,Baseline,Slow,6/22/2020,8/23/2020,0.319958825
  Louisiana,Baseline,Slow,6/22/2020,8/23/2020,0.123790885
  Maine,Baseline,Slow,6/22/2020,8/23/2020,0.015556364
  Maryland,Baseline,Slow,6/22/2020,8/23/2020,0.220330733
  Massachusetts,Baseline,Slow,6/22/2020,8/23/2020,0.483724956
  Michigan,Baseline,Slow,6/22/2020,8/23/2020,0.070705555
  Minnesota,Baseline,Slow,6/22/2020,8/23/2020,0.07992214
  Mississippi,Baseline,Slow,6/22/2020,8/23/2020,0.020743076
  Missouri,Baseline,Slow,6/22/2020,8/23/2020,0.383005757
  Montana,Baseline,Slow,6/22/2020,8/23/2020,0.037766845
  Nebraska,Baseline,Slow,6/22/2020,8/23/2020,0.126075523
  Nevada,Baseline,Slow,6/22/2020,8/23/2020,0.025215726
  New Hampshire,Baseline,Slow,6/22/2020,8/23/2020,-0.016976631
  New Jersey,Baseline,Slow,6/22/2020,8/23/2020,-0.040362574
  New Mexico,Baseline,Slow,6/22/2020,8/23/2020,-0.008309154
  New York,Baseline,Slow,6/22/2020,8/23/2020,0.006853333
  North Carolina,Baseline,Slow,6/22/2020,8/23/2020,0.101936426
  North Dakota,Baseline,Slow,6/22/2020,8/23/2020,0.021303572
  Ohio,Baseline,Slow,6/22/2020,8/23/2020,0.116985929
  Oklahoma,Baseline,Slow,6/22/2020,8/23/2020,-0.008881435
  Oregon,Baseline,Slow,6/22/2020,8/23/2020,0.076218222
  Pennsylvania,Baseline,Slow,6/22/2020,8/23/2020,0.097978046
  Rhode Island,Baseline,Slow,6/22/2020,8/23/2020,0.014108382
  South Carolina,Baseline,Slow,6/22/2020,8/23/2020,0.082904225
  South Dakota,Baseline,Slow,6/22/2020,8/23/2020,0.052244698
  Tennessee,Baseline,Slow,6/22/2020,8/23/2020,0.066716372
  Texas,Baseline,Slow,6/22/2020,8/23/2020,0.144157629
  United States,Baseline,Slow,6/22/2020,8/23/2020,4.88427558
  Utah,Baseline,Slow,6/22/2020,8/23/2020,0.173021003
  Vermont,Baseline,Slow,6/22/2020,8/23/2020,0.037262788
  Virginia,Baseline,Slow,6/22/2020,8/23/2020,0.145672078
  Washington,Baseline,Slow,6/22/2020,8/23/2020,0.088487627
  West Virginia,Baseline,Slow,6/22/2020,8/23/2020,7.48E-04
  Wisconsin,Baseline,Slow,6/22/2020,8/23/2020,0.338383245
  Wyoming,Baseline,Slow,6/22/2020,8/23/2020,0.041917106
  Alabama,Full,Baseline,6/22/2020,8/23/2020,0.446139755
  Alaska,Full,Baseline,6/22/2020,8/23/2020,0.092856944
  Arizona,Full,Baseline,6/22/2020,8/23/2020,0.673998374
  Arkansas,Full,Baseline,6/22/2020,8/23/2020,0.298921214
  California,Full,Baseline,6/22/2020,8/23/2020,0.19053054
  Colorado,Full,Baseline,6/22/2020,8/23/2020,0.441022716
  Connecticut,Full,Baseline,6/22/2020,8/23/2020,0.470867512
  Delaware,Full,Baseline,6/22/2020,8/23/2020,-0.026422683
  District of Columbia,Full,Baseline,6/22/2020,8/23/2020,-0.036765317
  Florida,Full,Baseline,6/22/2020,8/23/2020,0.419415206
  Georgia,Full,Baseline,6/22/2020,8/23/2020,0.771371392
  Hawaii,Full,Baseline,6/22/2020,8/23/2020,0.049823371
  Idaho,Full,Baseline,6/22/2020,8/23/2020,0.144504611
  Illinois,Full,Baseline,6/22/2020,8/23/2020,0.073212009
  Indiana,Full,Baseline,6/22/2020,8/23/2020,0.51118166
  Iowa,Full,Baseline,6/22/2020,8/23/2020,0.523052693
  Kansas,Full,Baseline,6/22/2020,8/23/2020,0.32507406
  Kentucky,Full,Baseline,6/22/2020,8/23/2020,0.498444667
  Louisiana,Full,Baseline,6/22/2020,8/23/2020,0.317442685
  Maine,Full,Baseline,6/22/2020,8/23/2020,0.015556364
  Maryland,Full,Baseline,6/22/2020,8/23/2020,0.741726244
  Massachusetts,Full,Baseline,6/22/2020,8/23/2020,1.09719741
  Michigan,Full,Baseline,6/22/2020,8/23/2020,0.070705555
  Minnesota,Full,Baseline,6/22/2020,8/23/2020,0.528079432
  Mississippi,Full,Baseline,6/22/2020,8/23/2020,0.131992752
  Missouri,Full,Baseline,6/22/2020,8/23/2020,0.812693075
  Montana,Full,Baseline,6/22/2020,8/23/2020,0.037766845
  Nebraska,Full,Baseline,6/22/2020,8/23/2020,0.272701157
  Nevada,Full,Baseline,6/22/2020,8/23/2020,0.215006091
  New Hampshire,Full,Baseline,6/22/2020,8/23/2020,-7.20E-04
  New Jersey,Full,Baseline,6/22/2020,8/23/2020,0.052722179
  New Mexico,Full,Baseline,6/22/2020,8/23/2020,0.169593703
  New York,Full,Baseline,6/22/2020,8/23/2020,0.100497689
  North Carolina,Full,Baseline,6/22/2020,8/23/2020,0.870480406
  North Dakota,Full,Baseline,6/22/2020,8/23/2020,0.087594056
  Ohio,Full,Baseline,6/22/2020,8/23/2020,1.001332992
  Oklahoma,Full,Baseline,6/22/2020,8/23/2020,0.338176173
  Oregon,Full,Baseline,6/22/2020,8/23/2020,0.313828055
  Pennsylvania,Full,Baseline,6/22/2020,8/23/2020,0.881071516
  Rhode Island,Full,Baseline,6/22/2020,8/23/2020,0.075784986
  South Carolina,Full,Baseline,6/22/2020,8/23/2020,0.163153173
  South Dakota,Full,Baseline,6/22/2020,8/23/2020,0.115132739
  Tennessee,Full,Baseline,6/22/2020,8/23/2020,0.083597206
  Texas,Full,Baseline,6/22/2020,8/23/2020,1.711629081
  United States,Full,Baseline,6/22/2020,8/23/2020,17.94283412
  Utah,Full,Baseline,6/22/2020,8/23/2020,0.397425904
  Vermont,Full,Baseline,6/22/2020,8/23/2020,0.063790661
  Virginia,Full,Baseline,6/22/2020,8/23/2020,0.184310812
  Washington,Full,Baseline,6/22/2020,8/23/2020,0.088487627
  West Virginia,Full,Baseline,6/22/2020,8/23/2020,0.130393415
  Wisconsin,Full,Baseline,6/22/2020,8/23/2020,0.903984423
  Wyoming,Full,Baseline,6/22/2020,8/23/2020,0.102471462
  Alabama,Full,Slow,6/22/2020,8/23/2020,0.456267699
  Alaska,Full,Slow,6/22/2020,8/23/2020,0.095859826
  Arizona,Full,Slow,6/22/2020,8/23/2020,0.721755408
  Arkansas,Full,Slow,6/22/2020,8/23/2020,0.309082399
  California,Full,Slow,6/22/2020,8/23/2020,0.19053054
  Colorado,Full,Slow,6/22/2020,8/23/2020,0.472362575
  Connecticut,Full,Slow,6/22/2020,8/23/2020,0.519929898
  Delaware,Full,Slow,6/22/2020,8/23/2020,-0.025866674
  District of Columbia,Full,Slow,6/22/2020,8/23/2020,-0.03366849
  Florida,Full,Slow,6/22/2020,8/23/2020,0.445315211
  Georgia,Full,Slow,6/22/2020,8/23/2020,0.817614858
  Hawaii,Full,Slow,6/22/2020,8/23/2020,0.054605557
  Idaho,Full,Slow,6/22/2020,8/23/2020,0.144285875
  Illinois,Full,Slow,6/22/2020,8/23/2020,0.073212009
  Indiana,Full,Slow,6/22/2020,8/23/2020,0.524956931
  Iowa,Full,Slow,6/22/2020,8/23/2020,0.541330414
  Kansas,Full,Slow,6/22/2020,8/23/2020,0.342200969
  Kentucky,Full,Slow,6/22/2020,8/23/2020,0.520062277
  Louisiana,Full,Slow,6/22/2020,8/23/2020,0.330288742
  Maine,Full,Slow,6/22/2020,8/23/2020,0.015556364
  Maryland,Full,Slow,6/22/2020,8/23/2020,0.798172163
  Massachusetts,Full,Slow,6/22/2020,8/23/2020,1.263083115
  Michigan,Full,Slow,6/22/2020,8/23/2020,0.070705555
  Minnesota,Full,Slow,6/22/2020,8/23/2020,0.571249713
  Mississippi,Full,Slow,6/22/2020,8/23/2020,0.132312588
  Missouri,Full,Slow,6/22/2020,8/23/2020,0.868360427
  Montana,Full,Slow,6/22/2020,8/23/2020,0.037766845
  Nebraska,Full,Slow,6/22/2020,8/23/2020,0.286265584
  Nevada,Full,Slow,6/22/2020,8/23/2020,0.237719054
  New Hampshire,Full,Slow,6/22/2020,8/23/2020,-4.12E-04
  New Jersey,Full,Slow,6/22/2020,8/23/2020,0.067908447
  New Mexico,Full,Slow,6/22/2020,8/23/2020,0.179534502
  New York,Full,Slow,6/22/2020,8/23/2020,0.142251194
  North Carolina,Full,Slow,6/22/2020,8/23/2020,0.919580558
  North Dakota,Full,Slow,6/22/2020,8/23/2020,0.089794116
  Ohio,Full,Slow,6/22/2020,8/23/2020,1.055651547
  Oklahoma,Full,Slow,6/22/2020,8/23/2020,0.345947619
  Oregon,Full,Slow,6/22/2020,8/23/2020,0.33435349
  Pennsylvania,Full,Slow,6/22/2020,8/23/2020,0.974330646
  Rhode Island,Full,Slow,6/22/2020,8/23/2020,0.081770971
  South Carolina,Full,Slow,6/22/2020,8/23/2020,0.164000809
  South Dakota,Full,Slow,6/22/2020,8/23/2020,0.118346341
  Tennessee,Full,Slow,6/22/2020,8/23/2020,0.086451887
  Texas,Full,Slow,6/22/2020,8/23/2020,1.811318728
  United States,Full,Slow,6/22/2020,8/23/2020,19.10318639
  Utah,Full,Slow,6/22/2020,8/23/2020,0.406171078
  Vermont,Full,Slow,6/22/2020,8/23/2020,0.065173708
  Virginia,Full,Slow,6/22/2020,8/23/2020,0.193727227
  Washington,Full,Slow,6/22/2020,8/23/2020,0.088487627
  West Virginia,Full,Slow,6/22/2020,8/23/2020,0.132907637
  Wisconsin,Full,Slow,6/22/2020,8/23/2020,0.961590995
  Wyoming,Full,Slow,6/22/2020,8/23/2020,0.102981779
  Alabama,Partial,Baseline,6/22/2020,8/23/2020,0.125934677
  Alaska,Partial,Baseline,6/22/2020,8/23/2020,0.025567408
  Arizona,Partial,Baseline,6/22/2020,8/23/2020,0.021450175
  Arkansas,Partial,Baseline,6/22/2020,8/23/2020,0.037642055
  California,Partial,Baseline,6/22/2020,8/23/2020,0.19053054
  Colorado,Partial,Baseline,6/22/2020,8/23/2020,0.037679646
  Connecticut,Partial,Baseline,6/22/2020,8/23/2020,0.084104373
  Delaware,Partial,Baseline,6/22/2020,8/23/2020,-0.026614103
  District of Columbia,Partial,Baseline,6/22/2020,8/23/2020,-0.040164273
  Florida,Partial,Baseline,6/22/2020,8/23/2020,0.230555754
  Georgia,Partial,Baseline,6/22/2020,8/23/2020,0.087003969
  Hawaii,Partial,Baseline,6/22/2020,8/23/2020,0.003887392
  Idaho,Partial,Baseline,6/22/2020,8/23/2020,-0.021379538
  Illinois,Partial,Baseline,6/22/2020,8/23/2020,0.073212009
  Indiana,Partial,Baseline,6/22/2020,8/23/2020,0.09286903
  Iowa,Partial,Baseline,6/22/2020,8/23/2020,0.268928861
  Kansas,Partial,Baseline,6/22/2020,8/23/2020,0.098604979
  Kentucky,Partial,Baseline,6/22/2020,8/23/2020,0.298341215
  Louisiana,Partial,Baseline,6/22/2020,8/23/2020,0.123790885
  Maine,Partial,Baseline,6/22/2020,8/23/2020,0.015556364
  Maryland,Partial,Baseline,6/22/2020,8/23/2020,0.163884814
  Massachusetts,Partial,Baseline,6/22/2020,8/23/2020,0.31783925
  Michigan,Partial,Baseline,6/22/2020,8/23/2020,0.070705555
  Minnesota,Partial,Baseline,6/22/2020,8/23/2020,0.07992214
  Mississippi,Partial,Baseline,6/22/2020,8/23/2020,0.020743076
  Missouri,Partial,Baseline,6/22/2020,8/23/2020,0.327338405
  Montana,Partial,Baseline,6/22/2020,8/23/2020,0.037766845
  Nebraska,Partial,Baseline,6/22/2020,8/23/2020,0.112511096
  Nevada,Partial,Baseline,6/22/2020,8/23/2020,0.02448742
  New Hampshire,Partial,Baseline,6/22/2020,8/23/2020,-0.016976631
  New Jersey,Partial,Baseline,6/22/2020,8/23/2020,-0.040362574
  New Mexico,Partial,Baseline,6/22/2020,8/23/2020,-0.018249953
  New York,Partial,Baseline,6/22/2020,8/23/2020,0.006853333
  North Carolina,Partial,Baseline,6/22/2020,8/23/2020,0.101936426
  North Dakota,Partial,Baseline,6/22/2020,8/23/2020,0.019103512
  Ohio,Partial,Baseline,6/22/2020,8/23/2020,0.116985929
  Oklahoma,Partial,Baseline,6/22/2020,8/23/2020,-0.01665288
  Oregon,Partial,Baseline,6/22/2020,8/23/2020,0.076218222
  Pennsylvania,Partial,Baseline,6/22/2020,8/23/2020,0.097978046
  Rhode Island,Partial,Baseline,6/22/2020,8/23/2020,0.014108382
  South Carolina,Partial,Baseline,6/22/2020,8/23/2020,0.082904225
  South Dakota,Partial,Baseline,6/22/2020,8/23/2020,0.049031096
  Tennessee,Partial,Baseline,6/22/2020,8/23/2020,0.066716372
  Texas,Partial,Baseline,6/22/2020,8/23/2020,0.144157629
  United States,Partial,Baseline,6/22/2020,8/23/2020,4.325080965
  Utah,Partial,Baseline,6/22/2020,8/23/2020,0.164275828
  Vermont,Partial,Baseline,6/22/2020,8/23/2020,0.037262788
  Virginia,Partial,Baseline,6/22/2020,8/23/2020,0.145672078
  Washington,Partial,Baseline,6/22/2020,8/23/2020,0.088487627
  West Virginia,Partial,Baseline,6/22/2020,8/23/2020,7.48E-04
  Wisconsin,Partial,Baseline,6/22/2020,8/23/2020,0.280776673
  Wyoming,Partial,Baseline,6/22/2020,8/23/2020,0.041406789
  Alabama,Partial,Slow,6/22/2020,8/23/2020,0.136062621
  Alaska,Partial,Slow,6/22/2020,8/23/2020,0.028570291
  Arizona,Partial,Slow,6/22/2020,8/23/2020,0.069207209
  Arkansas,Partial,Slow,6/22/2020,8/23/2020,0.04780324
  California,Partial,Slow,6/22/2020,8/23/2020,0.19053054
  Colorado,Partial,Slow,6/22/2020,8/23/2020,0.037679646
  Connecticut,Partial,Slow,6/22/2020,8/23/2020,0.133166759
  Delaware,Partial,Slow,6/22/2020,8/23/2020,-0.026614103
  District of Columbia,Partial,Slow,6/22/2020,8/23/2020,-0.040164273
  Florida,Partial,Slow,6/22/2020,8/23/2020,0.230555754
  Georgia,Partial,Slow,6/22/2020,8/23/2020,0.087003969
  Hawaii,Partial,Slow,6/22/2020,8/23/2020,0.003887392
  Idaho,Partial,Slow,6/22/2020,8/23/2020,-0.021598274
  Illinois,Partial,Slow,6/22/2020,8/23/2020,0.073212009
  Indiana,Partial,Slow,6/22/2020,8/23/2020,0.09286903
  Iowa,Partial,Slow,6/22/2020,8/23/2020,0.287206582
  Kansas,Partial,Slow,6/22/2020,8/23/2020,0.115731889
  Kentucky,Partial,Slow,6/22/2020,8/23/2020,0.319958825
  Louisiana,Partial,Slow,6/22/2020,8/23/2020,0.123790885
  Maine,Partial,Slow,6/22/2020,8/23/2020,0.015556364
  Maryland,Partial,Slow,6/22/2020,8/23/2020,0.220330733
  Massachusetts,Partial,Slow,6/22/2020,8/23/2020,0.483724956
  Michigan,Partial,Slow,6/22/2020,8/23/2020,0.070705555
  Minnesota,Partial,Slow,6/22/2020,8/23/2020,0.07992214
  Mississippi,Partial,Slow,6/22/2020,8/23/2020,0.020743076
  Missouri,Partial,Slow,6/22/2020,8/23/2020,0.383005757
  Montana,Partial,Slow,6/22/2020,8/23/2020,0.037766845
  Nebraska,Partial,Slow,6/22/2020,8/23/2020,0.126075523
  Nevada,Partial,Slow,6/22/2020,8/23/2020,0.025215726
  New Hampshire,Partial,Slow,6/22/2020,8/23/2020,-0.016976631
  New Jersey,Partial,Slow,6/22/2020,8/23/2020,-0.040362574
  New Mexico,Partial,Slow,6/22/2020,8/23/2020,-0.008309154
  New York,Partial,Slow,6/22/2020,8/23/2020,0.006853333
  North Carolina,Partial,Slow,6/22/2020,8/23/2020,0.101936426
  North Dakota,Partial,Slow,6/22/2020,8/23/2020,0.021303572
  Ohio,Partial,Slow,6/22/2020,8/23/2020,0.116985929
  Oklahoma,Partial,Slow,6/22/2020,8/23/2020,-0.008881435
  Oregon,Partial,Slow,6/22/2020,8/23/2020,0.076218222
  Pennsylvania,Partial,Slow,6/22/2020,8/23/2020,0.097978046
  Rhode Island,Partial,Slow,6/22/2020,8/23/2020,0.014108382
  South Carolina,Partial,Slow,6/22/2020,8/23/2020,0.082904225
  South Dakota,Partial,Slow,6/22/2020,8/23/2020,0.052244698
  Tennessee,Partial,Slow,6/22/2020,8/23/2020,0.066716372
  Texas,Partial,Slow,6/22/2020,8/23/2020,0.144157629
  United States,Partial,Slow,6/22/2020,8/23/2020,4.88427558
  Utah,Partial,Slow,6/22/2020,8/23/2020,0.173021003
  Vermont,Partial,Slow,6/22/2020,8/23/2020,0.037262788
  Virginia,Partial,Slow,6/22/2020,8/23/2020,0.145672078
  Washington,Partial,Slow,6/22/2020,8/23/2020,0.088487627
  West Virginia,Partial,Slow,6/22/2020,8/23/2020,7.48E-04
  Wisconsin,Partial,Slow,6/22/2020,8/23/2020,0.338383245
  Wyoming,Partial,Slow,6/22/2020,8/23/2020,0.041917106