1,800,000+
PWBM Simulations
|

3,300,000+
PWBM Articles Read
|

1,800,000+
PWBM Simulations
|

3,300,000+
PWBM Articles Read
|
Our Technology
Hover over the icons to reveal a brief description of that part of our process. Click for more information.
Our Method
Economic models typically fall into one of two categories: “reduced-form” or “structural.” Industry groups and traditional public policy models typically use the reduced-form approach. Reduced-form models incorporate rich detail about the real world, but they don’t account for how household and business decisions change under a new policy. So, reduced-form models are more appropriate for making economic forecasts under existing policy rather analyzing the impact of new policies. Academia typically employs “structural” models that account for how households and businesses change their decisions under a new policy, but these models typically make major abstractions from the real world.
Penn Wharton Budget Model combines the best of both types of models, thereby allowing for real-world detail while incorporating the ability to analyze new policy changes. PWBM combines modern advances in economic modeling, big data science, cloud computing and visualization tools to provide a “sandbox” that allows policymakers and the public to test their policy ideas before legislation is drafted. Our tools are transparent and accessible to all, without policy advocacy. Our interactive simulation tools provide instant visual feedback.
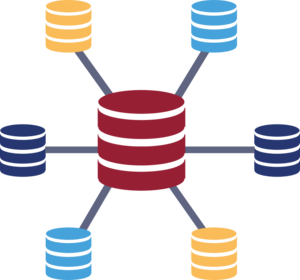
Penn Wharton Budget Model uses what is known as a “stochastic simulation.” Hundreds of thousands of individuals across a wide range of population subgroups are calibrated to Census-level data. Using a variety of additional large data sets, households are assigned key economic attributes including fertility, mortality, immigration, labor-force participation rates, education, marriage, divorce, capital, disabilities, and earnings. Households are then subject to various life events: They grow up, go to school, get married, maybe divorce, get jobs, pay taxes, and eventually retire and receive benefits. Businesses can take various forms (e.g., C-corp or various types of pass-through businesses) feature numerous attributes, including the domestic versus foreign location of assets and production. The model is first tested using historical data before being used to make projections of policy changes. These results feed into the dynamic version of our model that allows representative households and a business sector to change several key attributes in response to a change in policy, including choices regarding labor supply, capital holdings, debt-equity mix and other attributes. These changes then impact the economy, economic growth, and the distribution of income over time. In sum, our model incorporates the rich details of the existing economy before a policy change as well as the behavioral changes needed to analyze a new economy after a policy change.


