By Kent Smetters
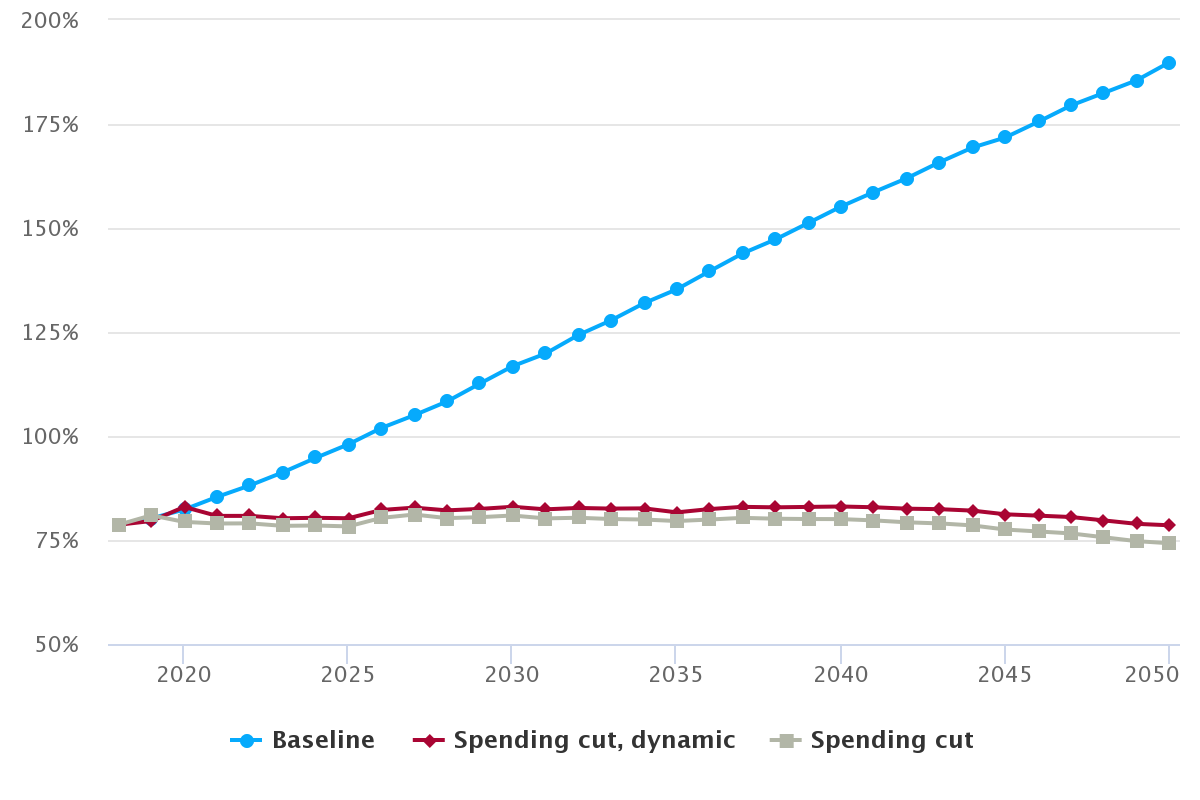
As Figure 1 shows, PWBM predicts federal debt held by the public will reach 190 percent of GDP by 2050, a bit larger than CBO’s long-term projection.1 In this blog entry, we consider the effects on major macroeconomic variables from stabilizing the debt-to-GDP ratio at its 2019 projected value, currently equal to around 80 percent of GDP. We consider two “stylized” policy changes: an increase in personal income tax revenue as well as a reduction in government spending.
Both policy changes stabilize the debt-to-GDP ratio on a conventional basis (without macroeconomic feedback effects) to around 80 percent of GDP. However, each policy change produces slightly different results on a dynamic basis (with macroeconomic feedback effects). Both policy changes are assumed to start in 2020, and we follow their impact on macroeconomic variables until 2050.

Note: Consistent with our previous dynamic analysis and the empirical evidence, the projections above assume that the U.S. economy is 40 percent open and 60 percent closed. Specifically, 40 percent of new government debt is purchased by foreigners.
Two Hypothetical Policy Changes
The two policy changes we consider are not meant to reflect actual policy options being widely discussed. Nor are they intended to be suggestive. Rather, they are used purely as illustrations of the potential macroeconomic impact of stabilizing the debt-to-GDP ratio.
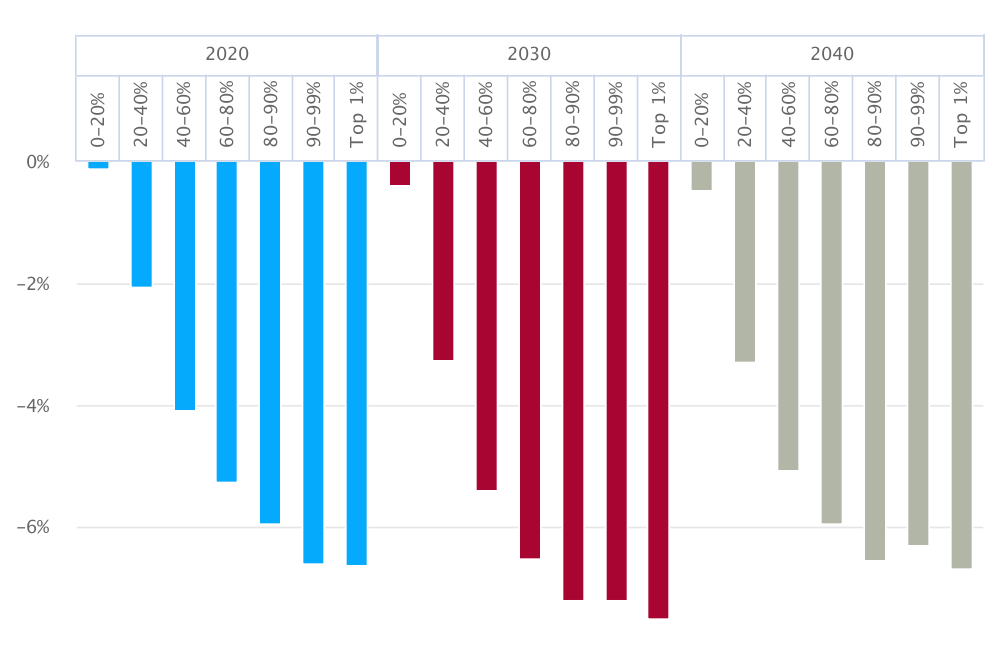
In the first policy change, we increase personal income tax rates by the same amount on all income earned above itemized and standard deductions. As shown in Table 1, to create debt-to-GDP stabilization, all personal income tax rates are increased above current law rates by seven percentage points during the years 2020-2025, by nine percentage points during the years 2026-2034, and by eight percentage points during the years 2035-2050. While this tax increase is proportional in nature, Figure 2 shows that the actual change in after-tax income across the pre-tax income distribution is still quite progressive in the presence of itemized and standard deductions. For example, the lowest 20 percent of the pre-tax income distribution sees almost no change in their after-tax income while the top 1 percent sees a reduction of over 7 percent.
| Year | Change |
|---|---|
| 2018-2019 | Current law |
| 2020-2025 | Current law rates + 7pp’s |
| 2025-2034 | Current law rates + 9 pp’s |
| 2035-2050 | Current law rates + 8 pp’s |
Note: “pp’s” means “percentage points”.
Note: The proportional increase to personal income taxes is levied on income above itemized and standard deductions.

Note: Income percentiles are calculated based on pre-tax income.
In the second policy change, we reduce government spending. However, we do not change Social Security and Medicare. Such a change would also impact “implicit debt” obligations since a large portion of these programs are financed using pay-as-you-go payroll taxes. It is cleaner to keep implicit debt obligations fixed across policy experiments. We also do not change public infrastructure spending, as that change would have a direct impact on private capital formation and productivity through the aggregate production function.
For this analysis, we hypothetically assume that cuts in non-entitlement and non-infrastructure federal government spending will not directly impact private capital formation and productivity. To be sure, spending on defense, education, welfare and other programs could, in reality, have a very material impact on capital formation, labor supply and productivity over time. However, PWBM already “closes” its dynamic model by implementing a hypothetical “closure rule” that stabilizes the debt-to-GDP rule starting in 2050. The closure rule is a standard modeling convention required of dynamic models with forward-looking households facing an increasing debt-to-GDP ratio over time (The Congressional Budget Office (CBO) also imposes a closure rule in its dynamic analysis.) Our closure rule similarly cuts government spending under the same assumptions. We originally implemented this approach prior to the 2017 tax reform debate to avoid introducing additional direct distortions to economic activity above “pure debt effects,” such as those associated with a future tax increase.2 Hence, cutting government spending in 2020 is equivalent to advancing the date at which our closure rule is implemented.
“Debt-Friendly” Assumptions
Besides our closure rule, the simulations reported in this blog entry make additional “debt-friendly” assumptions. First, our baseline projection of the government borrowing rate is consistent with baseline debt projections. However, we assume that the government borrowing rate itself mostly remains unchanged after either policy change noted above is implemented.3 We instead assume that debt only impacts the marginal return to capital, which reflects the return required by investors to invest in private capital projects. Not adjusting the government borrowing rate after a policy change reduces some of the debt “snowball” effect. If we instead assume that the government’s borrowing costs and the marginal product of capital move in lockstep, the impact of policy on debt would be substantially worse (or, conversely, substantially better, if reducing debt).
Second, we assume that foreigners buy 40 percent of newly issued government debt and private equity. A 40 percent marginal take-up rate for U.S. debt is consistent with the best empirical evidence. However, U.S. federal debt is known throughout the world as a safe asset. For example, foreign insurers hold large quantities of US debt as loss reserves. In contrast, the marginal take-up rate for U.S. equity is substantially less than 40 percent. Moreover, recent trade frictions might reduce foreign take-up rates over time.
Third, the analysis herein ignores the risks associated with a sudden and sharp increase in interest rates associated with a loss of confidence in U.S. debt as a safe asset. A loss of confidence could occur, for example, if investors started to believe that Congress will fail to enact comprehensive fiscal reforms, causing the U.S. Federal Reserve to eventually monetize some of the debt.
Current Interest Rates
Table 2 shows the current interest rates assumed in our analysis in the baseline (pre-policy change) economy. The real (after-inflation) return on equity (“marginal product of capital”) in 2020 is about 5.4 percent, which is at least 300 basis points less than calibrations used in dynamic simulation analysis published prior to 2008. This rate slowly increases to around 6.7 percent by 2050. The assumed risk-free rate, equal to the government’s maturity-weighted real borrowing costs, is negative in 2020 and 2021. This rate is after inflation and increases to around 1.3 percent by 2050. The difference between these two rates — the so-called equity premium — is fairly stable over time along the baseline economy.
| Year | Re4 | Rf5 | diff6 |
|---|---|---|---|
| 2020 | 5.39% | -0.23% | 5.62% |
| 2021 | 5.37% | -0.01% | 5.38% |
| 2022 | 5.15% | 0.17% | 4.98% |
| 2023 | 5.25% | 0.39% | 4.86% |
| 2024 | 5.43% | 0.55% | 4.88% |
| 2025 | 5.58% | 0.69% | 4.89% |
| ● ● ● ● ● ● | |||
| 2030 | 5.58% | 1.06% | 4.52% |
| ● ● ● ● ● ● | |||
| 2035 | 5.86% | 1.17% | 4.69% |
| ● ● ● ● ● ● | |||
| 2040 | 6.10% | 1.21% | 4.90% |
| ● ● ● ● ● ● | |||
| 2050 | 6.71% | 1.34% | 5.37% |
Note: Consistent with our previous dynamic analysis and the empirical evidence, the projections above assume that the U.S. economy is 40 percent open and 60 percent closed. Specifically, 40 percent of new government debt is purchased by foreigners.
Impact of Reducing Debt on Macroeconomic Variables
Table 3 shows that both policies to reduce debt increase GDP between 0.7 percent and 3.1 percent by 2040, and between 2.7 percent and 6.1 percent by 2050. These GDP gains are larger — by one to three times — as those we previously reported for the Tax Cuts and Jobs Act of 2017. Interestingly, even the policy to implement a broad-based proportional tax increase produces GDP gains. To be sure, high income tax rates clearly distort economic activity, as shown by the reduction in total labor supply in Table 3. However, even under our “debt-friendly” assumptions, the negative effects of debt on GDP are even more important due to debt’s deleterious impact on capital formation. This result holds even though the labor share of GDP is almost twice as large as the capital share of GDP.
| 2030 | 2040 | 2050 | |
|---|---|---|---|
| Economics (% change from baseline) | |||
| Increase taxes on ordinary income | |||
| GDP | -0.4% | 0.7% | 2.7% |
| Capital supply | 2.0% | 3.7% | 9.0% |
| Labor supply | -1.5% | -0.8% | -0.4% |
| Reduce government spending | |||
| GDP | 1.1% | 3.1% | 6.1% |
| Capital supply | 3.5% | 8.8% | 17.7% |
| Labor supply | 0.0% | 0.2% | 0.6% |
| Debt-GDP ratios | |||
| Baseline | 117% | 155% | 190% |
| Increase taxes on ordinary income | 83% | 83% | 79% |
| Reduce government spending | 81% | 80% | 74% |
Note: Consistent with our previous dynamic analysis and the empirical evidence, the projections above assume that the U.S. economy is 40 percent open and 60 percent closed. Specifically, 40 percent of new government debt is purchased by foreigners.
-
In 2018, the experts at the Congressional Budget Office predicted that debt will reach 152 percent of GDP by 2048. PWBM’s current projection for 2048 is 182 percent. However, CBO warned of potentially larger debt-to-GDP ratios in its 2018 report, and it will soon release its updated estimates. Besides differences in when these estimates were generated, PWBM and CBO differ somewhat in how they model the impact of debt on private capital formation. PWBM takes a statistical structural approach while CBO takes a statistical reduced-form approach. The structural approach produces nonlinear effects in the level of debt. ↩
-
In theory, implementing a closure rule with distorting taxes starting in 2050 could decrease or increase baseline GDP prior to 2050, depending on a tradeoff of different economic factors. For realistic model calibrations, however, a distorting closure rule tends to reduce baseline GDP relative to reducing non-productive government spending. ↩
-
One caveat concerns the term structure of government debt. In particular, the federal government sells bonds using a mixture different maturities and interest rates. PWBM has developed a model that projects the mixture of maturities at different debt levels. As total debt changes in time, the mixture, therefore, changes with policy as well, producing small differences in the maturity-weighted borrowing rate. ↩
-
Re: Real after-tax corporate equity return, before household taxes. ↩
-
Rf: Real duration-weighted risk-free rate. ↩
-
diff: equity premium before household taxes. ↩
    ,Baseline,Tax increase,Spending cut
    2018,0.786522828,0.78660348,0.78660348
    2019,0.801950478,0.795698899,0.809334288
    2020,0.823224717,0.82944631,0.793521602
    2021,0.853562599,0.80795806,0.78966063
    2022,0.881247305,0.808003629,0.790009658
    2023,0.912556317,0.80224088,0.784020184
    2024,0.947273184,0.803387705,0.784822341
    2025,0.980028317,0.802233635,0.782700892
    2026,1.019218855,0.822128083,0.803089192
    2027,1.049837173,0.827815831,0.811250845
    2028,1.082916379,0.821258957,0.802608069
    2029,1.125867136,0.824748377,0.804865544
    2030,1.167839143,0.829816519,0.808886769
    2031,1.198036155,0.823708726,0.801942197
    2032,1.242773153,0.827051163,0.803496279
    2033,1.278188023,0.82548858,0.800420188
    2034,1.319213519,0.826072933,0.799231137
    2035,1.352698563,0.816481128,0.795600741
    2036,1.396210976,0.824348486,0.799201639
    2037,1.438823508,0.829711809,0.803246616
    2038,1.472501871,0.828540052,0.801211445
    2039,1.511923072,0.829534247,0.800411028
    2040,1.551598298,0.830572983,0.800208287
    2041,1.586404302,0.828693232,0.797141919
    2042,1.619524863,0.825324921,0.792527796
    2043,1.658154945,0.82410483,0.789904902
    2044,1.693340398,0.820661587,0.785090667
    2045,1.717576796,0.811776906,0.775146985
    2046,1.755108085,0.808568092,0.770556128
    2047,1.794551919,0.805252918,0.765853489
    2048,1.824701399,0.797136968,0.756588332
    2049,1.855018909,0.78884242,0.747210376
    2050,1.898333691,0.785362502,0.742201195
    ,0-20%,20-40%,40-60%,60-80%,80-90%,90-99%,Top 1%
    2020,-0.000973071,-0.02063282,-0.041019633,-0.0527797,-0.059627001,-0.066132465,-0.066454807
    2030,-0.003966714,-0.032725014,-0.054175651,-0.065295339,-0.072101611,-0.072161002,-0.075263488
    2040,-0.004703643,-0.033003298,-0.050696346,-0.059530042,-0.065667142,-0.063160107,-0.067001271
