We previously defined a measure of effective openness of the U.S. economy to foreign investment flows. We found that, historically, when tariff rates increase, effective openness is lower. Here, we compare the relationship between effective openness and average interest rates on U.S. government bonds with 10-year maturities.1 Figure 1 displays effective openness and 10-year interest rates in each year.
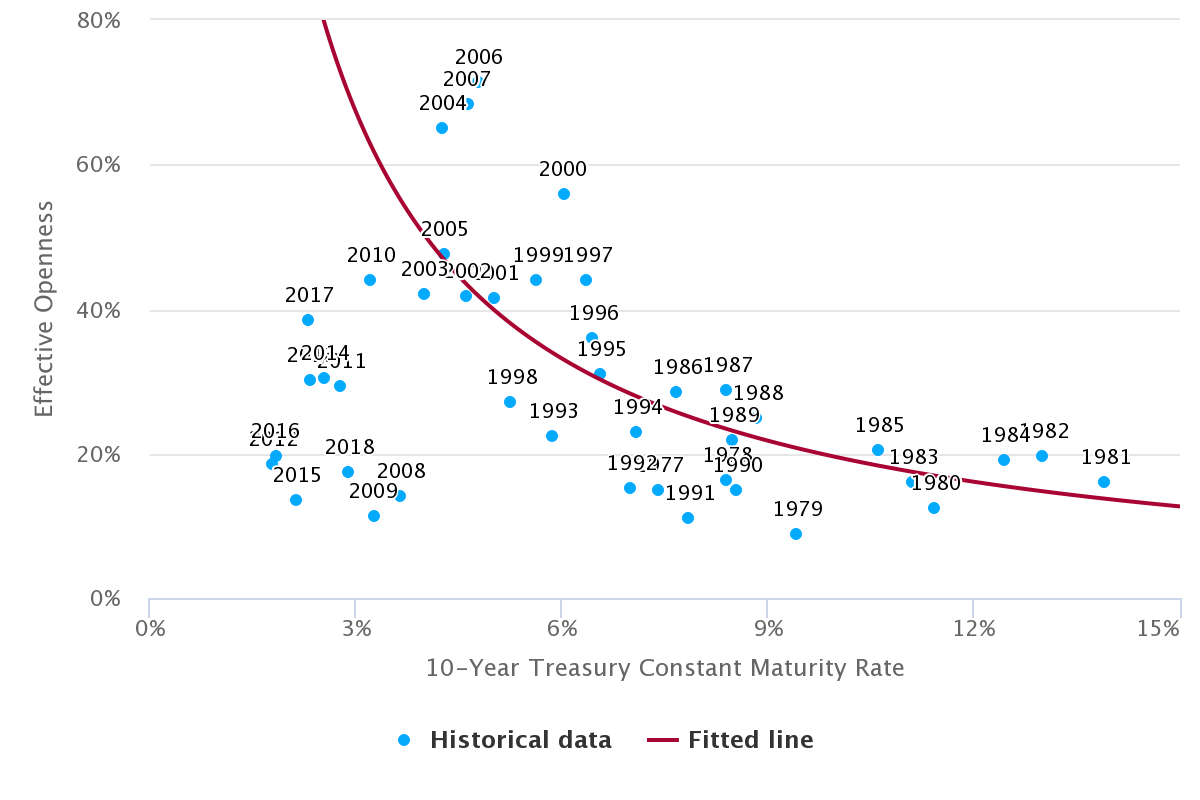
Source: Federal Reserve Bank of St. Louis. Treasury Constant Maturity Rate. Available at: https://fred.stlouisfed.org/categories/115.
Demand for government debt assets by all market participants influences the market interest rate on that debt. All else equal, more demand increases the price of government debt, which is equivalent to a lower interest rate. We examine the relationship between foreign demand, measured as effective openness, and the interest rate.
We abstract from a number of features of the debt market, including the effect of secular changes in the supply of debt by U.S. fiscal policy and major interventions by the Federal Reserve in credit markets. For example, during the Quantitative Easing interventions by the Fed, the Fed aggressively purchased longer maturity assets from 2009-2014. Even after expanding its balance sheet, the Fed continued to rollover its assets until 2018, when it stopped purchasing new bonds as older issues matured.
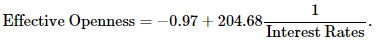
The fitted line in Figure 1 shows the estimated relationship between effective openness and interest rates on 10-year Treasury debt:2
As the effective openness of the economy increases, interest rates decline. This correlation is consistent with the finding in Warnock and Warnock (2009) that foreign purchases of U.S. government bonds have a significant inverse relationship to long-term interest rates.3
While there appears to be a connection between 10-year rates and effective openness, the relationship between effective openness and short-term rates is less clear. If short-term rates are almost entirely set by policy, we expect effective openness to have little effect on them. In addition, we do not expect a strong relationship because foreign demand for long-term Treasury debt is usually higher than demand for short-term debt.4 Figure 2 displays effective openness and interest rate on 3-month U.S. Treasurys in each year. We find that effective openness and short-term interest rates do not appear to be related unless we exclude periods of easing5 (that is, lowering of the federal funds rate).
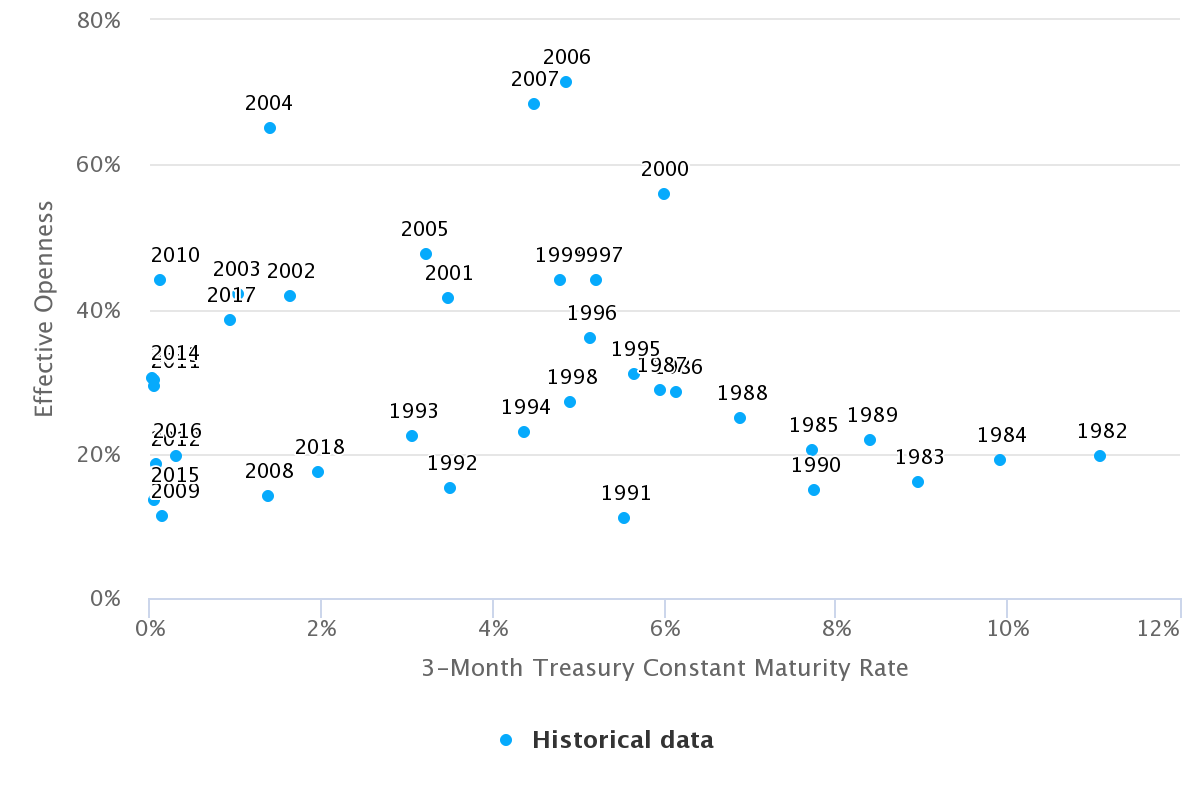
Source: Federal Reserve Bank of St. Louis. Treasury Constant Maturity Rate. Available at: https://fred.stlouisfed.org/categories/115.
Our basic empirical analysis of effective openness and federal debt interest rates shows that foreign asset demand has an inverse relationship with long-term interest rates. We previously found an inverse relationship between tariff rates and openness. Thus, in a trade-war scenario, we expect higher interest rates on federal debt, unless the Fed steps in. Higher interest payments on government debt would generate a worse outcome for the U.S. economy, and would, for example, increase the dynamic cost that we previously estimated for the “Tax Cuts and Jobs Act.”
-
Federal Reserve Bank of St. Louis. Treasury Constant Maturity Rate. Available at: https://fred.stlouisfed.org/categories/115. ↩
-
Our nonlinear regression model takes the form of 1/x with an R-squared measure of 0.41. ↩
-
Warnock, F. and Warnock. V (2009), “International capital flows and U.S. interest rates,” Journal of International Money and Finance, vol. 28, pp. 903-919. ↩
-
U.S. Department of the Treasury. U.S. liabilities to foreigners re U.S. Securities. Available at: https://www.treasury.gov/resource-center/data-chart-center/tic/Pages/shlreports.aspx. ↩
-
Federal Reserve Bank of St. Louis. Effective Federal Funds Rate. Available at: https://fred.stlouisfed.org/series/FEDFUNDS. ↩
    Year,Effective Openness,10-Year Treasury Constant Maturity Rate
    1977,14.882520,7.417631
    1978,16.344530,8.408387
    1979,8.789809,9.432943
    1980,12.553840,11.433440
    1981,16.193010,13.921370
    1982,19.704980,13.005500
    1983,16.120740,11.103000
    1984,19.137510,12.458110
    1985,20.501090,10.619800
    1986,28.616640,7.672840
    1987,28.889670,8.392680
    1988,24.862590,8.848000
    1989,21.790340,8.493720
    1990,14.841640,8.552400
    1991,11.100410,7.862440
    1992,15.263670,7.008845
    1993,22.465090,5.866280
    1994,23.016010,7.085181
    1995,31.036090,6.573920
    1996,35.924610,6.443532
    1997,44.068480,6.353960
    1998,27.172660,5.262880
    1999,44.060410,5.646135
    2000,55.888970,6.030279
    2001,41.533860,5.020686
    2002,41.693580,4.613080
    2003,42.058710,4.013880
    2004,64.979290,4.271320
    2005,47.567840,4.288880
    2006,71.357430,4.795000
    2007,68.243290,4.634661
    2008,14.241000,3.664263
    2009,11.295330,3.264120
    2010,43.957350,3.215060
    2011,29.346550,2.781640
    2012,18.423290,1.803440
    2013,30.182090,2.350160
    2014,30.390370,2.539560
    2015,13.559910,2.138287
    2016,19.792030,1.837440
    2017,38.488070,2.329480
    2018,17.416940,2.911245
    Year,Effective Openness,3-Month Treasury Constant Maturity Rate
    1982,19.70498000,11.08992000
    1983,16.12074000,8.95132000
    1984,19.13751000,9.91855400
    1985,20.50109000,7.72383100
    1986,28.61664000,6.14636000
    1987,28.88967000,5.96488000
    1988,24.86259000,6.88592000
    1989,21.79034000,8.39456000
    1990,14.84164000,7.74648000
    1991,11.10041000,5.53960000
    1992,15.26367000,3.51434300
    1993,22.46509000,3.06600000
    1994,23.01601000,4.37249000
    1995,31.03609000,5.66036000
    1996,35.92461000,5.14559500
    1997,44.06848000,5.20144000
    1998,27.17266000,4.90696000
    1999,44.06041000,4.77760900
    2000,55.88897000,5.99992000
    2001,41.53386000,3.47866900
    2002,41.69358000,1.63532000
    2003,42.05871000,1.02804000
    2004,64.97929000,1.39872000
    2005,47.56784000,3.21612000
    2006,71.35743000,4.85156000
    2007,68.24329000,4.48095600
    2008,14.24100000,1.39685300
    2009,11.29533000,0.15092000
    2010,43.95735000,0.13844620
    2011,29.34655000,0.05284000
    2012,18.42329000,0.08760000
    2013,30.18209000,0.05708000
    2014,30.39037000,0.03272000
    2015,13.55991000,0.05251000
    2016,19.79203000,0.31936000
    2017,38.48807000,0.94896000
    2018,17.41694000,1.97168700