PWBM projects that Social Security's combined trust fund depletes in February 2035 with a 75-year shortfall of 4.65 percent of taxable payroll, close to the 2026 Trustees Report despite offsetting differences in fertility and mortality projections.
PWBM projects the U.S. resident population will grow from 343.5 million in 2026 to 371.5 million in 2056, with net immigration accounting for more than 100 percent of this growth. Real GDP growth slows from 2.2 percent to 1.1 percent as growing mandatory spending is matched with shrinking working-age labor force participation.
Over 700,000 Temporary Protected Status (TPS) recipients lose legal status by the end of 2025, including 550,000 who are legally working. We estimate that TPS recipients contribute over $36 billion in annual GDP. Withdrawing their work authorization could add to labor shortages in construction, cleaning, and hospitality, especially in Florida, Texas and New York.
The current Social Security program faces a significant shortfall, equal to 4.2 percent of all future covered payroll over the next 75 years. This shortfall persists under alternative and favorable projections of fertility, interest rates, immigration and the projected impact of AI on future wages.
Cohabitation rates have increased significantly during the last two decades. Cohabiting individuals appear to have weaker workforce engagement and earnings. With changing U.S. demographics, the trend toward favoring cohabitation over marriage appears likely to continue.
The COVID-19 spike in mortality is the pandemic’s most direct demographic consequence, but not the only one. Factoring in changes in fertility, disruptions to immigration, and indirect demographic spillovers, we estimate that the pandemic reduced the U.S. population 0.5 percent over the long term.
The COVID-19 pandemic led to a decline in births in 2020 followed by a rebound in 2021. We present new estimates of “excess” births during the pandemic, which show that on net over the two-year period, births were roughly in line with pre-pandemic trends.
Improvements in U.S. life expectancy stalled in the 2010s, years before the COVID-19 pandemic produced a spike in mortality. We present new estimates of historical patterns in mortality by socio-demographic group and projections of U.S. mortality through 2060.
The impact of income-driven repayment (IDR) educational financing plans by income, race, and gender is not generally well understood. Our analysis estimates that approximately 43 percent of the subsidies from President Biden’s Saving on a Valuable Education (SAVE) plan will accrue to current Black student borrowers and 71 percent to current female borrowers. While lower- to middle-income student borrowers stand to gain the most, we estimate that about a fifth of the benefits will go to households in the top 20 percent of the income distribution, and borrowers with graduate-level education who benefit from the SAVE plan tend to experience the highest savings on average.
U.S. population growth is projected to decline, and the population will become much older over time. Preventing these outcomes will require faster immigration by several multiples of its current rate.
We report estimates from the Penn Wharton Budget Model (PWBM) that exempting employment-based green cards from statutory limits for applicants (and their families) who have earned a doctoral or master’s degree in a STEM field---similar to Section 80303 in H.R. 4521---would reduce federal budget deficits by $129 billion from 2025 to 2034. In contrast, a conventional budget estimate, which would include projected increases in federal spending but not the effect of a larger population on federal tax revenues, shows an increase in federal deficits of $4 billion.
The economic costs of the COVID-19 pandemic were widely expected to fall disproportionally on women. Instead, the employment rate of prime age women recovered faster than men’s and rose to its highest point in U.S. history in 2023. We show that the resilience of women’s employment is driven by two long-term trends that predate the pandemic and continued through it: 1) the growing share of women who are college graduates, and 2) the rising labor force participation of college-educated mothers with young children.
Under current law, we project that national debt will rise to 225% of GDP by 2050 and continue to rise thereafter. Changing demographics will reduce future economic growth.
The U.S. population’s total fertility rate is now approximately 1.7 births per female, which is below the replacement rate of 2.1 that is required for the U.S. population not to shrink without increases in immigration. Women are delaying motherhood, from the 2006 average age range of 25 to 29 to the 30 to 34 age range today.
In 2018 and 2019, age-specific mortality rates for ages 60 through 80 continued to decline by 0.5 percent annually. For the same age group, age-specific mortality increased for those without a high school diploma but decreased 2.5 percent for those with a BA or advanced degrees.
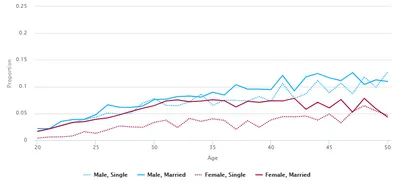
We relate the decline in the birth rate to two demographic factors closely associated with women’s fertility patterns: marriage and educational attainment. Married women are at least three percentage points more likely to have a child than unmarried women, and simultaneously marriage rates among women 25 to 29 declined 15.9 percent since 2006. Women who complete 4 years of college are less likely to have a child, while completion rates of 4 years of college rose 10 percent for women over the past decade.
In a general equilibrium, overlapping generations model with heterogeneous agents and stochastic labor productivity, we account for differences between immigrants and natives to investigate the macroeconomic effects of immigration to the United States. Including household labor productivity transitions jointly with legal status transitions, we model policies which change the size and composition of the immigrant population and analyze implications for government spending and tax revenues. Temporary increases in legal immigration rates lead to long term fiscal benefits, in aggregate and on a per capita basis, in part because of decreases in the old-age dependency ratio. These policies produce long lasting, multi-generational effects, as the children of new immigrants enter the workforce. A six year increase in legal immigration by 25% is predicted to lead to a 0.08% increase in per capita GDP and a 0.41% decrease in total government debt in 2032, but, by 2052, the policy increases per capita GDP by 0.30% while government debt is 1.34% lower than in the baseline. Policies which legalize unauthorized immigrants imply a trade-off between higher wages for newly-legalized workers and increased government debt through additional spending on social programs for those same immigrants. A full legalization policy leads to a 0.02% increase in government debt by 2032 and a 1.26% increase by 2052. Per capita GDP, meanwhile, is 0.01% lower than baseline in 2032 and 0.37% lower in 2052.
We estimate that White households inherit over 5.3 times as much as Black households and 6.4 times as much as Hispanic households. White households are 2.8 times more likely than Black households to inherit any wealth. Differences in inheritances reflect and may contribute to wealth differences by race.
Households in the top 5 percent of the income distribution receive inheritances between 4 to 12 times larger than households in the bottom 80 percent, depending on the exact definition of inheritance used.
PWBM projects that by 2050, the legalization provisions of the U.S. Citizenship Act proposed by President Biden would increase the size of the U.S. population by 4.21 percent, increase GDP by 0.5 percent, but decrease GDP per capita by 0.2 percent. More specific legalization proposals targeted at farm workers, DACA recipients, and essential workers would each increase GDP per capita by 0.1 percent in 2050.
PWBM estimates that schools in the Philadelphia and surrounding suburb districts with more Black students are less likely to reopen with in-person instruction relative to schools with more White students, even after controlling for differences in income by district. By March 2021, Black students in grades K-5 have incurred a 11.9 percent loss in lifetime income from school closures while White students have lost 10.4 percent. Students educated in the city face larger losses than students educated in the surrounding suburbs.
The Biden healthcare plan focuses on expanding access and affordability of insurance and decreasing prescription drug prices. We estimate that by 2030, relative to current law, the Biden plan would decrease the uninsurance rate from 10 percent to 6 percent, decrease private insurance premiums by 23 percent and out-of-pocket spending by 16 percent, and decrease the percent of the population that forgoes medical care from 7 percent to 4 percent. The Biden healthcare plan would increase net spending by $352 billion over ten years but would reduce debt by 4.5 percent over that period due to dynamic growth effects.
Additional education is associated with similar reductions in mortality rates for men and women—in 2016, for example, men and women with high school degrees had mortality rates 16 percent and 14 percent lower, respectively, than those without degrees. That same year, however, the mortality advantage of completing a high school degree was 18 percentage points higher for White people than for Black people.
Over the last two decades, a mortality gap has opened up across education levels. For those born after 1950, each additional level of educational attainment is associated with at least an 18 percent lower mortality rate.
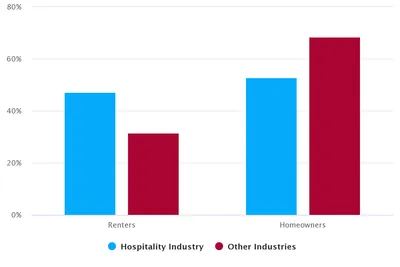
The economic downturn due to coronavirus has disproportionately harmed workers in the leisure and hospitality businesses, such as restaurants and bars—these workers tend to be less-educated and lower-income.
Background: Assessing patient experiences with healthcare and publicly reporting this information is increasingly prevalent. Patients use this data when reviewing physicians and hospital systems. Measurements of patient satisfaction are increasingly integrated into payment policies from insurance companies. Objective: This study analyzes (1) the relationship of physician characteristics and treatment modalities to patient satisfaction scores among primary care physicians and (2) the relationship of higher patient satisfaction scores to compliance with health maintenance objectives like mammography and colonoscopy. Main Measures: CAHPS survey as administered by Press Ganey for Main Line Health Care physicians in suburban Philadelphia. Survey data obtained on 115 physicians over 345 "doctor-years." Patient data identified by ICD9/10 codes linked to chief complaints of (1) upper respiratory illness (2) back pain and (3) fatigue, depression and anxiety. Treatment modalities groupings include (a) prescriptions for antibiotics (b) prescriptions for narcotics, (c) prescriptions for stimulants, (d) prescriptions for benzodiazepines, and (e) orders for radiologic imaging. Rates of colonoscopies and mammograms per provider were obtained for the year 2017. Key Results: Providers in practice for longer periods of time received higher top box scores. There is a significant difference in top box scores for female physicians years 0-3 and 4-9 when compared to male physicians in practice more than 10 years. There is a significant relationship between top box scores and the physician's rate of writing prescriptions for benzodiazepines, narcotics and stimulants. There is a positive correlation between top box score and compliance with mammography and colonoscopy screenings. Conclusions: Press Ganey top box score correlates with physician gender, years of experience, and certain treatment modalities. There is a correlation between high patient satisfaction scores and rate of mammography and colonoscopy compliance. Our results do not imply a causative relationship but may be suggestive that one exists.
Introducing PWBM’s Interactive 2020 Campaign Issue State Maps. We use data to inform people about the impact of campaign proposals on their states. Here we present six indicators focused on immigration policy for each state. Although PWBM has shown that increasing immigration boosts economic growth for the U.S. as a whole, these indicators imply that the impact of changes to immigration policy on a state will depend on the demographics of that state.
We project that increasing annual net legal immigration leads to a younger and more educated U.S. population. These population changes are likely to have a positive impact on entitlement finances and tax burdens relative to current policy. In contrast, decreasing annual net legal immigration likely has the opposite effects.
PWBM projects the number of unauthorized immigrants to fall from a peak of 4 percent of the U.S. population in 2007 to under 2.5 percent in 2050. In recent years, fewer unauthorized immigrants have arrived from Mexico while more have arrived from Central America. PWBM projects that future growth of the population of unauthorized immigrants will be driven by visa overstays.
When making projections of key macroeconomic aggregates such as total output, earnings and payroll tax bases, the Social Security Trustees assume that future labor-productivity growth will continue to remain close to its historical average. The labor productivity projection derived from this assumption is applied to the projected worker population on a per-head basis to project the aforementioned variables. However, assuming labor productivity growth near its historical average implicitly assumes that all contributing factors will also grow close to their historical rates or changes in those factors total will be mutually offsetting. However, the future composition of workers by productive abilities will differ from the past, potentially causing inconsistency between projections of key macroeconomic aggregates and the underlying characteristics of the future population. One solution is to project as many of the productivity-contributing elements as possible using micro data information and organize them under an aggregate production function framework. This approach forces the budget analyst to define all productive inputs consistently with underlying demographic projections. Under such an approach, labor productivity growth is an auxiliary output consistent with micro-data-based projections of future worker populations, their attributes, macroeconomic aggregates, and projections of finances for programs such as Social Security. PWBM's microsimulation-based projection of U.S. demographic and economic features yields labor productivity growth estimates that are significantly smaller during the next few decades compared with the close-to-historical average rate of labor productivity growth assumed by the Social Security Trustees. Subtracting PWBM's average projected labor-productivity growth over the next 75 years (2018-92) from the Social Security Trustees' assumed value of 1.68 percent per year yields a difference of 26 basis points. If the effects of changes in the population's demographic attributes on labor productivity growth are excluded from PWBM's projection, the difference from the Trustees labor-productivity growth assumption equals 32 basis points.
The PWBM Simulator implements micro-level projections of individuals and families in the United States to observed trends and interactions among many demographic and economic variables. Historical estimates and projections are rigorously validated using many sources of micro-data information in the United States. Using PWBM-Simulator output to implement tax policy analysis requires mapping its distributions of individuals and families into distributions of tax filing units with appropriate income elements calibrated to observed features of U.S. tax filers. This paper described the procedures used for augmenting PWBM Simulator's micro projections with tax variables from the IRS's public use tax-return samples –the Statistics of Income surveys.