Effective Tariff Rates and Revenues (Updated July 13, 2026)
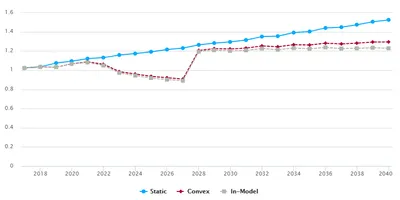
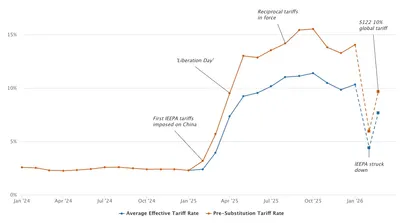
The USITC recently released updated trade and tariff data. As of May 2026, the effective tariff rate stood at 7.2 percent.

Browse posts by date
The USITC recently released updated trade and tariff data. As of May 2026, the effective tariff rate stood at 7.2 percent.
PWBM projects that Social Security's combined trust fund depletes in February 2035 with a 75-year shortfall of 4.65 percent of taxable payroll, close to the 2026 Trustees Report despite offsetting differences in fertility and mortality projections.

We estimate that the United States federal debt cannot rationally exceed roughly 210 percent of GDP as an outer limit. Under historical excess cost growth in healthcare, this outer limit is likely reached within 20 years; there is a 25% chance of reaching it in 14 years. Debt markets unravel earlier if beliefs about government repayment shift.

PWBM projects the U.S. resident population will grow from 343.5 million in 2026 to 371.5 million in 2056, with net immigration accounting for more than 100 percent of this growth. Real GDP growth slows from 2.2 percent to 1.1 percent as growing mandatory spending is matched with shrinking working-age labor force participation.

DOL's proposed experience benchmarking alternative would raise mean H-1B compensation by $27,686 (+24.7%) over the random lottery — $7,076 above the NPRM primary rule — while excluding 56 percent of current registrations and shifting selections toward younger workers.

The USITC recently released updated trade and tariff data. We estimate an effective tariff rate of 7.1 percent as of March 2026, the first full month after the IEEPA tariffs were replaced by a global 10 percent tariff implemented under Section 122.

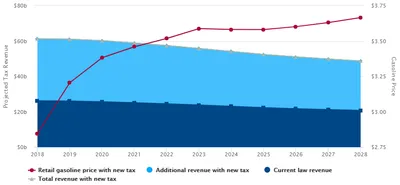
A four-month federal gas tax suspension would cost the Highway Trust Fund roughly $11.5 billion in lost revenue, with consumers seeing only partial price relief.
DOL's proposed prevailing wage increase would nearly double the compensation effect of the new wage-weighted H-1B lottery, raising mean selected-registrant pay by $20,611 (+18.4%) over the prior random lottery.

PWBM estimates Operation Epic Fury has cost $27–28 billion in the first 32 days, with projected two-month direct costs of $38–47 billion if fighting continues to the end of April, with another $5 billion in indirect costs.
American retirees receive over twice as much in total federal outlays as working-age adults and six times more than children and young adults. These ratios are even larger on a per-capita basis. Expenditures on retirees are projected to rise even more.

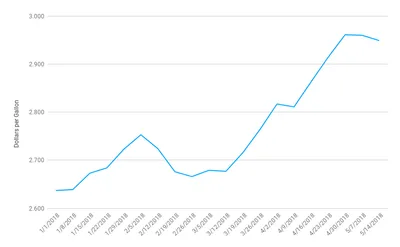
Projected per-gallon price drops and two-month revenue losses if states suspend gasoline and diesel taxes.
We project that Social Security's Old-Age and Survivors Insurance Trust Fund will deplete in six years (2032). We consider five different reform options that vary in the amount of tax increases and benefit cuts. Traditional policy analysis that dominates federal policymaking often provides very different — even opposite — insights compared to more comprehensive modeling.

The USITC recently released updated trade and tariff data. We estimate an effective tariff rate (ETR) of 10.3 percent through January 2026. We project that replacing the IEEPA tariffs with a new 10% global tariff rate lowers the ETR to 7.7 percent on a bias-corrected basis appropriate for short-term projections.
Two Senate proposals widen the zero tax bracket — Senator Booker's KYPA through a doubled standard deduction (costing $5.1 trillion) and Senator Van Hollen's WATCA through an alternative maximum tax (costing $1.4 trillion) — illustrating how mechanism determines cost, targeting, and distortions.
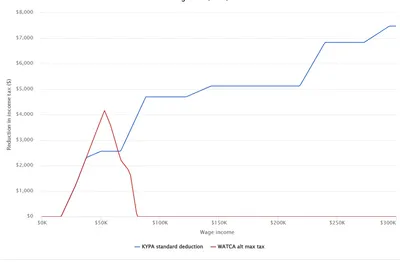
Senator Van Hollen's Working Americans' Tax Cut Act would pair a new alternative maximum tax for low- and middle-income filers with a graduated millionaire surtax, increasing federal revenue by $264 billion over a decade, not including economic feedback effects.

We estimate that the Keep Your Pay Act proposed by Senator Cory Booker would reduce federal revenues by up to $6.4 trillion over a decade. Households earning $100,000–$200,000 receive the largest tax cuts. Separately, on social media, Senator Booker proposed a top-rate increase that we estimate would offset about $1.4 trillion.

We analyze how employers could exploit DHS' new H-1B lottery rules by reclassifying positions into closely related occupations with lower prevailing wages to increase their chance of selection. We find that 61 percent of registrations would achieve a higher wage level through reclassification, undoing 42 percent of the expected compensation increase.

We project that reversing the IEEPA tariffs will generate up to $175 billion in refunds. Unless replaced by another source, future tariff revenue collections will fall by half.

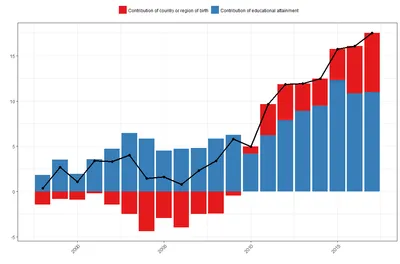
We project that the new DHS H-1B selection rule, going into effect in March 2026, will shift the H-1B visa allocation toward higher-paid and higher-education foreign-born workers, but by less than alternative designs being debated. Based on data from the current random lottery in the last five years, we estimate that the new DHS rule will have no significant impact on wages of U.S.-born workers, including non-college, college-educated, and STEM workers. Any reduction in competition from fewer STEM H-1Bs is offset by a reduction in productivity growth.
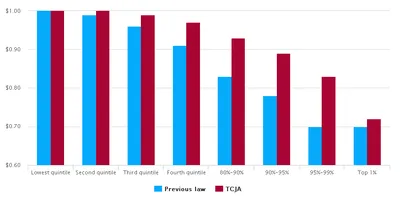
Revenue and distributional effects of lowering the cap on the marginal tax benefit of itemized deductions to 32% or 24%.
Over 700,000 Temporary Protected Status (TPS) recipients lose legal status by the end of 2025, including 550,000 who are legally working. We estimate that TPS recipients contribute over $36 billion in annual GDP. Withdrawing their work authorization could add to labor shortages in construction, cleaning, and hospitality, especially in Florida, Texas and New York.

We project that corporate tax revenue will decrease by $276 billion over 10 years on a conventional basis due to changes in international tax provisions related to the Section 250 deduction under OBBBA.

The current Social Security program faces a significant shortfall, equal to 4.2 percent of all future covered payroll over the next 75 years. This shortfall persists under alternative and favorable projections of fertility, interest rates, immigration and the projected impact of AI on future wages.

PWBM estimates that the COVID-era Employee Retention Credit (ERC) will have cost more than $300 billion when the IRS finishes processing claims later in 2025, nearly four times the initial projected cost. Most of the ERC was paid retroactively, well after pandemic-related economic disruptions had ended, limiting its effectiveness as a worker retention incentive.

We estimate that AI will increase productivity and GDP by 1.5% by 2035, nearly 3% by 2055, and 3.7% by 2075. AI’s boost to annual productivity growth is strongest in the early 2030s but eventually fades, with a permanent effect of less than 0.04 percentage points due to sectoral shifts.

It is well known that mass deportation reduces aggregate economic variables like GDP due to scale effects. We project that deportation also reduces wages of high-skill workers, compromising 63% of workers. Still, authorized low-skilled workers can see their wages increase but only if the deportation policy is permanently sustained after 4 years. Even with new funds provided in the 2025 OBBBA, we estimate that permanent deportation would cost an additional $900 billion over the first 10 years.

We estimate that importers avoided 13.1 percent ($6.5 billion) of new tariffs by accelerating purchases and changing their purchasing patterns in response to the new tariff regime. Importers especially stockpiled pharmaceuticals and precious metals during 2025 Q1.

We estimate the reconciliation bill signed by President Trump increases primary deficits by $3.2 trillion over 10 years. The dynamic cost, including changes to the economy, is larger at $3.6 trillion. GDP falls by 0.3 percent in 10 years and 4.6 percent in 30 years.

For the final bill, please see our analysis of the President Trump-Signed Reconciliation Bill .
Deporting unauthorized workers over 10 years cuts Social Security revenue, raises deficits by $133 billion (10 yrs) and $884 billion (30 yrs). The Trust Fund depletes 6 months earlier; 75-year deficit rises by 0.25% of payroll.
For the final bill, please see our analysis of the President Trump-Signed Reconciliation Bill .
We examine recent capital market dynamics in the context of budget reconciliation and trade policies. Understanding these dynamics requires modeling the interaction between microeconomic behavior and macroeconomic outcomes—an approach particularly well suited for the overlapping-generations lifecycle model.

For the final bill, please see our analysis of the President Trump-Signed Reconciliation Bill .

If spending and tax changes in Reconciliation are made permanent, federal debt increases by 11.1 percent in 10 years and 24.3 percent in 30 years. GDP remains flat and wages fall by 0.5 percent. Dynamic costs exceed conventional costs in the budget window.

We estimate the House reconciliation bill increases primary deficits by $3.3 trillion over 10 years. Even so, GDP rises in the short and long term, as precautionary increases in labor supply and savings respond to a reduced social safety net.

For the final bill, please see our analysis of the President Trump-Signed Reconciliation Bill .

Under current law, the 2017 Tax Cuts and Jobs Act (TCJA) will expire at the end of 2025, raising personal income tax rates back to 2017 levels. Some lawmakers propose extending the TCJA but with higher rates for high-income households. We consider three options.

Treasury data through April 28 shows that tax receipts are broadly in line with government projections made earlier this year, before the downsizing of the IRS was announced. Receipts from tariffs have significantly exceeded projections.

Many trade models fail to capture the full harm of tariffs. PWBM projects Trump’s tariffs (April 8, 2025) will reduce long-run GDP by about 6% and wages by 5%. A middle-income household faces a $22K lifetime loss. These losses are twice as large as a revenue-equivalent corporate tax increase from 21% to 36%, an otherwise highly distorting tax.

We evaluate two immigration policies that shift 10 percent of future low-skilled immigration toward either: (i) high-skilled immigrants (“ HSI ”) that otherwise maintains the current share of STEM workers within the high-skilled group, or (ii) only high-skilled STEM workers (“ HSI STEM ”) that increases the share of STEM relative to other high-skill workers. The number of total immigrants remains the same under both policies. Both policies grow the economy, reduce federal debt, and increase wages across all income groups: lower-skilled, higher-skilled non-STEM workers, and higher-skilled STEM workers. In fact, this policy change affords the rare opportunity of a “Pareto improvement” benefitting all groups.

For the final bill, please see our analysis of the President Trump-Signed Reconciliation Bill .

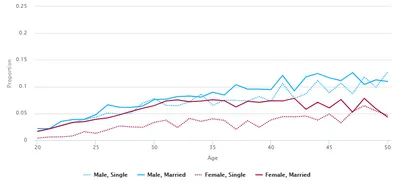
Cohabitation rates have increased significantly during the last two decades. Cohabiting individuals appear to have weaker workforce engagement and earnings. With changing U.S. demographics, the trend toward favoring cohabitation over marriage appears likely to continue.

Eliminating taxes on Social Security benefits reduces incentives to save and work while increasing federal debt. Wages and GDP fall over time. The policy primarily benefits high-income households nearing or in retirement while harming households under thirty and all future generations across the entire income distribution.

Treasury debt held by the public is an explicit pay-as-you-go obligation. The government also runs implicit pay-as-you-go obligations, such as Social Security and Medicare Part A, which are twice as large. Both types of obligations require tax increases and spending cuts to balance the budget over time.

The deduction for pass-through income under section 199A provides a benefit in excess of 20 percent (“excess benefit”) for some taxpayers due to its interaction with the progressive tax rate system. As Congress considers extending 199A beyond 2025, options to remove the excess benefit while maintaining the 20 percent tax benefit could raise between $46B and $178B over the 10-year budget window, depending on design.

A package of 13 major tax and spending reforms, based on standard public economics design principles, is shown to reduce federal debt, increase social insurance, and expand the economy more than any previously analyzed policies by PWBM.

President Biden recently proposed that Medicare and Medicaid cover obesity medications starting in 2026. PWBM estimates a 10-year cost of $140 billion.

The COVID-19 spike in mortality is the pandemic’s most direct demographic consequence, but not the only one. Factoring in changes in fertility, disruptions to immigration, and indirect demographic spillovers, we estimate that the pandemic reduced the U.S. population 0.5 percent over the long term.

The COVID-19 pandemic led to a decline in births in 2020 followed by a rebound in 2021. We present new estimates of “excess” births during the pandemic, which show that on net over the two-year period, births were roughly in line with pre-pandemic trends.

We analyze new data from the US Treasury to examine historical revenue effects of TCJA’s international corporate tax provisions. We also provide updated conventional estimates to assess the revenue impact of scheduled 2026 rate increases on foreign income of US corporations and assess several proposals that aim to further increase tax revenue.

We explain how the PWBM uses its dynamic Overlapping Generation (OLG) model to analyze tax policies affecting foreign-earned income by affiliates of U.S.-domiciled firms. We evaluate two illustrative policy changes: we show how firms’ tax liabilities and the allocation of capital between domestic and international production are affected by an increase in foreign tax rates and a decrease in U.S. tax exemptions on foreign-derived income.

The COVID-19 pandemic caused major disruptions to U.S. immigration. Policymakers imposed travel restrictions, stopped visa processing, and made significant changes at the border. The pandemic and policy response led to more employment-based immigration and increased illegal border crossings instead of reducing them.

We examine two major investment tax incentives for the computer sector. The impact on computer-sector investment as well as economy-wide investment is very small, even when the computer sector is modeled as a production complement.

After Ireland ended the Double Irish tax planning strategy in 2020, US firms with historical links to Ireland have shifted their intellectual property (IP) away from traditional tax havens to Ireland and the US to take advantage of tax incentives offered by both countries. This has coincided with a significant increase in Irish corporate tax revenue, particularly for less capital-intensive firms. Repatriation of foreign earnings to the United States has also increased, but fiscal benefits to the US have been offset by tax incentives passed under TCJA.

Improvements in U.S. life expectancy stalled in the 2010s, years before the COVID-19 pandemic produced a spike in mortality. We present new estimates of historical patterns in mortality by socio-demographic group and projections of U.S. mortality through 2060.

The impact of income-driven repayment (IDR) educational financing plans by income, race, and gender is not generally well understood. Our analysis estimates that approximately 43 percent of the subsidies from President Biden’s Saving on a Valuable Education (SAVE) plan will accrue to current Black student borrowers and 71 percent to current female borrowers. While lower- to middle-income student borrowers stand to gain the most, we estimate that about a fifth of the benefits will go to households in the top 20 percent of the income distribution, and borrowers with graduate-level education who benefit from the SAVE plan tend to experience the highest savings on average.

For more election analysis, check out our Election 2024 page .

For more election analysis, check out our Election 2024 page .
We analyze a new illustrative policy to create automatic retirement savings accounts for more than 56 million low-income Americans by 2030. The program is fully financed by removing the gross income adjustment for traditional 401k and similar retirement accounts without any additional contribution from households or employers. The program relies on the existing EITC administration without employer participation. After accounting for risk, individual account balances reach over $200,000 by retirement and any balances can be bequeathed upon death.

PWBM estimates that President Biden’s FY2025 budget proposal would reduce primary deficits by $1.7 trillion over the 2025-2034 budget window. Accounting for economic feedback effects, GDP falls by 0.8 percent relative to current law in 2034. By 2054, debt falls by 5.4 percent and GDP declines by 1.3 percent relative to current law.

Note: This document was updated on 5/30/2024 to include a discussion of how much of the policy would be paid for by economic feedback effects.

Note: This document was updated on 5/21/2024 to include a conventional distributional analysis and a dynamic distributional analysis of the three policy bundles.

We examine recent trends in the activities of US multinationals and their foreign affiliates using data from the Bureau of Economic Analysis’s annual survey of US direct investment abroad. Since the passage of the Tax Cuts and Jobs Act (TCJA), multinational activity has become more domestically concentrated, continuing a trend that started before the legislation. This has coincided with a decline in the US effective corporate tax rate and relatively stable foreign effective tax rates.

We estimate that President Biden’s recently announced “New Plans” to provide relief to student borrowers will cost $84 billion, in addition to the $475 billion that we previously estimated for President Biden’s SAVE plan. Moreover, some debt relief in the New Plans accrues to borrowers in households with income more than the SAVE plan coverage.

U.S. population growth is projected to decline, and the population will become much older over time. Preventing these outcomes will require faster immigration by several multiples of its current rate.

For more election analysis, check out our Election 2024 page .

PWBM estimates that the Wyden-Smith tax proposal ( H.R. 7024 ) would reduce revenues by $3 billion over the next decade on a conventional basis.

PWBM estimates that exempting from immigrants with advanced STEM degrees from numerical limitations on green cards would reduce deficits by $129 billion over the 2025-2034 period and by $634 billion over the 2035-2044 period.

We report estimates from the Penn Wharton Budget Model (PWBM) that exempting employment-based green cards from statutory limits for applicants (and their families) who have earned a doctoral or master’s degree in a STEM field---similar to Section 80303 in H.R. 4521---would reduce federal budget deficits by $129 billion from 2025 to 2034. In contrast, a conventional budget estimate, which would include projected increases in federal spending but not the effect of a larger population on federal tax revenues, shows an increase in federal deficits of $4 billion.

The economic costs of the COVID-19 pandemic were widely expected to fall disproportionally on women. Instead, the employment rate of prime age women recovered faster than men’s and rose to its highest point in U.S. history in 2023. We show that the resilience of women’s employment is driven by two long-term trends that predate the pandemic and continued through it: 1) the growing share of women who are college graduates, and 2) the rising labor force participation of college-educated mothers with young children.

The House of Representatives is considering legislation that would rescind $14.3 billion of IRS funding as a budgetary offset for a package that provides aid to Israel. CBO estimates that the decrease in IRS funding alone would reduce revenue by $26.8 billion over 10 years, increasing the deficit by $12.5 billion. Due to scoring conventions, CBO’s projected deficit increase could not be reversed for any future legislation that adds the $14.3 billion in funding back to the IRS.

The OECD expects countries to implement components of Pillar Two, its framework for a global minimum tax, starting in 2024. The US is likely to cede tax rights to foreign jurisdictions if it does not enact new tax law. Pillar Two will likely reshape the nature of tax competition between countries, incentivizing greater use of subsidies and refundable tax credits to counteract higher statutory rates.

Despite a complete overhaul of the US system of international corporate taxation in the Tax Cuts and Jobs Act of 2017, taxes on US corporations’ foreign income are about the same after the law’s enactment as before.

PWBM estimates that---even under myopic expectations---financial markets cannot sustain more than the next 20 years of accumulated deficits projected under current U.S. fiscal policy. Forward-looking financial markets are, therefore, effectively betting that future fiscal policy will provide substantial corrective measures ahead of time. If financial markets started to believe otherwise, debt dynamics would “unravel” and become unsustainable much sooner.

Note (August 2024): Updated budgetary cost for President Biden’s SAVE Plan is available here .

Federal student loan borrowers can currently choose between several repayment options. When estimating program costs, government agencies have considered several different behavioral repayment models. We find that the most financially savvy rule – where borrowers select the repayment option that minimizes the present value of their future repayments – best explains current borrower choices among repayment options that exist prior to the new Income-Driven Repayment Plan (IDR) “SAVE” plan to be implemented in July 2024.

PWBM estimates that Title I of the Build It in America Act would add $76 billion to the budget deficit over the next decade and reduce deficits by $18 billion during the subsequent second decade. It would temporarily boost business investment and GDP during the next two years while lowering GDP in subsequent years. If lawmakers made the extensions permanent, the budgetary cost would rise to $1.25 trillion over the next two decades and GDP would largely remain unchanged, as the tax incentive effects and debt effects mostly offset.

PWBM estimates the Tax Cuts for Working Families Act would reduce federal revenues by $96 billion over a decade, cutting taxes for a majority of households in 2024. Households in the bottom quintile households, and those in the top 1 percent, generally would not benefit. As an illustration, we also consider making the provisions permanent, which raises the estimated ten-year budget cost to be between $419 billion and $527 billion.

PWBM estimates that “SAVE Students Act” would cost about $276 billion less over the 10-year budget window relative to the Income-Driven Repayment (IDR) plan proposed by President Biden.

We estimate the Fiscal Responsibility Act (“FRA”) of 2023 will reduce noninterest spending by $1.3 trillion over the 10-year budget window using standard scoring assumptions. If discretionary spending in Fiscal Year 2026, after sequestration is no longer in effect, deviates from standard scoring assumptions, the spending reduction could be as low as $234 billion or as high as $1.8 trillion.
The deadline to raise the nation’s debt ceiling is closer than previously thought because tax receipts in April fell below projections. PWBM estimates that receipts are running $150 billion below government projections for fiscal year 2023, most likely due to a decline in capital gains income and weakening corporate profit margins.

Several revenue and spending provisions in The Tax Cuts and Jobs Act (TCJA) are scheduled to expire (“sunset”) by the end of 2025. We estimate that “extenders” (“no sunset”) would increase the federal debt held by the public from 226.0 percent of GDP to 261.1 percent of GDP by 2050.

PWBM estimates that President Biden’s new Medicare proposal would increase the solvency of the Medicare trust fund from the year 2028 to 2053. However, a significant share of that increase comes from redirecting existing (current law) revenue to the trust fund. Another portion comes from unspecific expenditure reductions that lack the details required to score. Counting only new income without unspecified expenditure reductions, we project, as an illustrative alternative, that the HI trust fund would remain solvent until 2037.

President Biden has proposed raising the current excise tax rate on stock repurchases from 1 percent to 4 percent. We estimate that, for domestic shareholders, this tax increase would eliminate about 85 percent of the current-law tax preference for dividends over stock repurchases.

We estimate President Biden’s newly proposed Income-Driven Repayment (IDR) Plan will cost between $333 to $361 billion over the 10-year budget window, more than twice as much as the cost estimate released by the Biden Administration. These costs are in addition to the one-time cost of direct loan forgiveness that we previously estimated at $469 billion .

Under current law, we project that national debt will rise to 225% of GDP by 2050 and continue to rise thereafter. Changing demographics will reduce future economic growth.

President Biden’s new student loan forgiveness plan includes three major components. We estimate that debt cancellation alone will cost up to $519 billion, with about two-thirds of the benefit accruing to households making $88,000 or less. Loan forbearance will cost another $16 billion. The new income-driven repayment (IDR) program would cost another $70 billion, increasing the total plan cost to $605 billion under strict “static” assumptions. However, depending on future IDR program details to be released and potential behavioral (i.e., “non-static”) changes, total plan costs could exceed $1 trillion.

We estimate that forgiving federal college student loan debt will cost between $300 billion and $980 billion over the 10-year budget window, depending on program details. About 70 percent of debt relief accrues to borrowers in the top 60 percent of the income distribution.

PWBM estimates that the Senate-passed version of the Inflation Reduction Act would reduce non-interest cumulative deficits by $264 billion over the budget window. The impact on inflation is statistically indistinguishable from zero. GDP falls slightly within the first decade while increasing slightly by 2050. Most, but not all, of the tax increases fall on higher income households.

PWBM and CBO find an almost identical impact of the Inflation Reduction Act of 2022 (“IRA”) on the budget, with small differences stemming from the timing of the corporate minimum tax revenue. The impact on inflation is statistically indistinguishable from zero for either estimate.

PWBM estimates that the Inflation Reduction Act would reduce non-interest cumulative deficits by $248 billion over the budget window with no impact on GDP in 2031. The impact on inflation is statistically indistinguishable from zero. An illustrative scenario is also presented where Affordable Care Act subsidies are made permanent. Under this illustrative alternative, the 10-year deficit reduction estimate falls to $89 billion.

We estimate that the federal estate tax would have generated 9 times more revenue in 2019 without the tax changes in 2001 and 2017.
The U.S. population’s total fertility rate is now approximately 1.7 births per female, which is below the replacement rate of 2.1 that is required for the U.S. population not to shrink without increases in immigration. Women are delaying motherhood, from the 2006 average age range of 25 to 29 to the 30 to 34 age range today.

In 2018 and 2019, age-specific mortality rates for ages 60 through 80 continued to decline by 0.5 percent annually. For the same age group, age-specific mortality increased for those without a high school diploma but decreased 2.5 percent for those with a BA or advanced degrees.

We relate the decline in the birth rate to two demographic factors closely associated with women’s fertility patterns: marriage and educational attainment. Married women are at least three percentage points more likely to have a child than unmarried women, and simultaneously marriage rates among women 25 to 29 declined 15.9 percent since 2006. Women who complete 4 years of college are less likely to have a child, while completion rates of 4 years of college rose 10 percent for women over the past decade.

We estimate that suspending the federal excise tax on gasoline from July to September this year would lower average gasoline spending per capita by between $4.79 and $14.31 over three months, depending on geographic location and modeling assumptions, and lower federal tax revenue by about $6 billion during that period.

We estimate that the U.S. federal government faces a permanent fiscal imbalance equal to over 10 percent of all future GDP under current law where future federal spending outpaces tax and related receipts. Federal government debt will climb to 236 percent of GDP by 2050 and to over 800 percent of GDP by year 2095 (within 75 years).

We provide causal evidence that recent suspensions of state gasoline taxes in three states were mostly passed onto consumers at some point during the tax holiday in the form of lower gas prices: Maryland (72 percent of tax savings passed onto consumers), Georgia (58 percent to 65 percent) and Connecticut (71 percent to 87 percent). However, these price reductions were often not sustained during the entire holiday.

We estimate that each new preschooler for a universal pre-K program requires about $21,000 in new construction costs for facilities expansion. Including non-construction costs, a universal pre-K program for three- and four-year-olds will cost about $351 billion over the 10-year budget window. If made permanent after 10 years, this program will have essentially no impact on long-run GDP. A pre-K program for just four-year-olds reduces the 10-year cost to $196 billion and slightly increases long-run GDP, if that program is made permanent.

Households owed more than $500 billion in taxes when they filed their returns this year, an increase of about $200 billion from immediately prior to the pandemic. The large tax liability owed at filing is mostly the result of a surge in capital gains and other income from financial assets in 2021.

We project that President Biden’s FY2023 Budget, taken as a whole, would reduce debt and grow the economy by 0.4 percent over time, with two major components of the Budget---"Build Back Better” and “New Provisions”---working in opposite directions.

Build Back Better (BBB) Act allocates about $550 billion to climate change policies. Provisions that are funded with user fees can grow the economy while deficit financing can shrink the economy.


We estimate that suspending the federal gas tax from March to December 2022 would lower average gasoline spending per capita between $16 and $47, depending on geographic location and assumptions, but lower federal tax revenue by about $20 billion over that period.

PWBM estimates that Medicaid’s inflation adjusted expenditures on Long Term Care services will increase from $130 billion in 2020 (0.62 percent of GDP) to $179 billion in 2030 (0.71 percent of GDP). We project that Medicaid expenditures on Nursing Home and Home Health will increase 4.7 percent and 6.9 percent per year above inflation through 2030, respectively.

This brief examines different approaches to removing the capital gains “lock-in effect” within a realization-based tax framework. We estimate that this change would produce between $115 billion and $357 billion in additional tax revenue over the next 10 years, depending on the exact design.

PWBM estimates that auto-enrolling into a Medicare Advantage (MA) plan those who age into Medicare and fail to sign up for Medicare Fee-For-Service (FFS) or another MA plan would increase enrollment in the MA program by 1.4 million people in 2032 and increase federal outlays by $189 billion over the 2022-32 period. If we assume that in response to such a policy change people would lose the incentive to enroll in Medicare FFS and instead get automatically enrolled into a MA plan, enrollment would increase by 6.8 million people in 2032 and outlays would increase by $269 billion over the 2022-32 period.

We estimate that increases in wage earnings in 2021 offset the higher cost of living due to inflation for most households with incomes between $20,000 and $100,000. Higher-income households saw their earnings rise by more than their cost of living, while the lowest-income households (below $20,000) saw their earnings rise by only one third of their increase in cost of living.

We estimate that White households inherit over 5.3 times as much as Black households and 6.4 times as much as Hispanic households. White households are 2.8 times more likely than Black households to inherit any wealth. Differences in inheritances reflect and may contribute to wealth differences by race.

PWBM projects that the spending and taxes in the Build Back Better Act (H.R. 5376), as written, would add up to 0.2 percentage points to inflation over the next two years and reduce inflation by similar amounts later in the decade. As an illustrative alternative, if temporary major spending provisions were made permanent, the bill would add up to a third of a percentage point to near-term inflation and have a negligible impact on inflation later in the decade.

We estimate that inflation in 2021 will require the average U.S. household to spend around $3,500 more in 2021 to achieve the same level of consumption of goods and services as in recent previous years (2019 or 2020). Moreover, we estimate that lower-income households spend more of their budget on goods and services that have been more impacted by inflation. Lower-income households will have to spend about 7 percent more while higher-income households will have to spend about 6 percent more.

PWBM estimates that H.R. 5376, the Build Back Better Act, would increase spending by $2.1 trillion over the 10-year budget window while increasing revenue by $1.8 trillion, for a 10-year deficit of $274 billion. By 2050, the proposal would decrease GDP by 0.2 percent, relative to current law.

PWBM projects that Sen. Wyden’s billionaire income tax proposal would raise $507 billion over the budget window, more than half of which would come from a one-time transition tax on previously accrued, unrealized capital gains on publicly traded assets.

PWBM estimates that the White House’s Build Back Better reconciliation framework would increase spending by $1.87 trillion over the 10-year budget window and revenues by $1.56 trillion over the same period. By 2050, the proposal would increase federal debt by 2.0 percent and decrease GDP by 0.1 percent, relative to the current law baseline.

Using recently available data on learning loss from pandemic school closures, PWBM estimates that projected 2051 GDP is 1.4 percent lower than it would have been without the learning loss. Extending the 2021-22 school year for all public schools by one month would cost $78 billion and limit the reduction in 2051 GDP to 1.0 percent—a net present value gain in GDP of more than $1 trillion over the next three decades, equal to a $15.14 return for each $1 invested.

PWBM projects the House Ways and Means Committee proposal to temporarily extend the 2021 Child Tax Credit design would provide an average 2022 refundable tax cut of $2,785 to 78 percent of households with children at a budgetary cost of $545 billion over the 10-year budget window. Changes to phase-out and phase-in thresholds would reduce the budgetary cost but also reduce the size of the tax cuts.

Higher inflation reduces the real value of the government’s outstanding debt while increasing the tax burden on capital investment due to lack of inflation indexing. Increasing the current annual inflation target regime from 2 percent to 3 percent inflation reduces debt while lowering GDP.

PWBM estimates that tax policy changes in low-tax countries in response to the recent OECD global minimum tax deal could cost the U.S. as much as 50 percent of its minimum tax revenue.

PWBM projects that the long-run aggregate macroeconomic effects of Senator Joe Manchin's $1.5T reconciliation framework would be negligible. The economic benefits would largely accrue to younger, poorer households while the economic costs would fall mostly on richer households.

Working part-time or full-time while enrolled in college is not uncommon, but students who do so tend to fall behind their peers in terms of grades or spending more time in undergraduate study, even after controlling for other characteristics such as household resources.

We project that recent tax reforms proposed by the House Ways and Means Committee would increase the incentive of U.S. firms to shift intangible investments and profits to foreign countries with a tax rate below 20.7 percent.

The House Ways and Means Committee reforms proposed as part of budget reconciliation would increase the U.S. statutory corporate income tax rate to 26.5 percent, bringing the combined federal and state rate to 30.9 percent, making the U.S. rate the third highest among OECD members.

The House Ways and Means Committee reforms proposed as part of budget reconciliation would more than triple the U.S. tax rate on multinationals’ foreign income and produce a higher rate than a proposed global agreement currently being negotiated through the OECD.

Even after accounting for differences in observed student ability, students coming from lower-income households are less likely to attend college. If they attend college, lower-income students are also more likely to attend a two-year community college.

Measures of student ability typically used for college admissions implicitly reflect differences in family income across students. However, high school GPA reflects differences in income noticeably less than SAT and ACT scores. However, SAT and ACT scores do capture aspects of student ability missed by school-specific rankings alone.

Student performance in high school is a strong predictor of future success at college, including performance at two-year and four-year colleges, the likelihood of transferring from two-year colleges to four-year colleges, and eventually obtaining degrees.

PWBM projects that the revenue-raising provisions in the House Ways and Means Reconciliation Bill would raise roughly $2.4 trillion from 2022 to 2031.


The USDA re-evaluation of the Thrifty Food Plan increases the average SNAP benefit by $36.24 per person per month starting in October 2021. PWBM projects that the increase in SNAP spending lowers GDP by 0.2 percent by 2031. People who receive SNAP as well as older working age individuals are helped by policy change while young people with high incomes as well as rich retirees are harmed due to lower future wages and a fall in the return to capital.

By 2051, we find that a combination of targeted preschool and targeted childcare programs increase GDP by 0.1 percent relative to current policy, even if deficit financed. Universal versions of these programs are more costly and would instead reduce GDP by 0.2 percent by 2051.

We analyze a combination of net revenue raisers consistent with the requirements released by the Senate Budget Committee on August 9th, 2021, for budget reconciliation.

About 30 percent of students who first attend two-year community college are from families with incomes above the median income for students attending four-year colleges. Moreover, upwards of one-fifth of top students from relatively small and large high schools first attend a two-year institution.

The bipartisan Senate infrastructure deal, endorsed by President Biden, authorizes about $548 billion in additional infrastructure investments, which we estimate is funded by $132 billion in new tax provisions and $351 billion in new deficits. We project that proposal would have no significant effect on GDP by end of the budget window (2031) or in the long run (2050).

We estimate that the recent OECD proposal for a global minimum tax would triple the effective U.S. tax rate on foreign income from 2 percentage points to 5.8 percentage points. The Biden administration’s proposed changes to the U.S. global minimum tax regime would instead raise the effective U.S. tax rate on foreign income to 12.4 percentage points.

Households in the top 5 percent of the income distribution receive inheritances between 4 to 12 times larger than households in the bottom 80 percent, depending on the exact definition of inheritance used.

Under current law, PWBM projects that U.S. multinationals will report a cumulative $3.6 trillion in Global Intangible Low-Taxed Income (GILTI) between 2022 and 2031. Data released in July 2021 by the Internal Revenue Service for the 2018 tax year provides the first opportunity for a more extensive validation of PWBM’s model of U.S. multinationals’ tax returns. PWBM projects 2018 GILTI within 5.3 percent of the IRS value, suggesting a very good model fit.

PWBM estimates that President Biden’s FY2022 budget proposal would increase spending by $5.9 trillion and increase revenue by $3.9 trillion over the 2022-2031 budget window. By 2050, we project that the President’s budget proposals would decrease public debt by 7.3 percent and decrease GDP by 1.1 percent relative to current law.

The bipartisan Senate infrastructure deal, endorsed by President Biden, authorizes $1.2 trillion of spending, representing about $579 billion in additional infrastructure investments funded by a mix of deficits, user fees, and other tax provisions. This proposal would increase output in 2050 by 0.1 percent.

PWBM projects that the legalization provisions of the U.S. Citizenship Act proposed by President Biden would increase per capita spending on the Supplemental Nutrition Assistance Program (SNAP) by 1.2 percent in 2031 and 0.7 percent 2050 relative to the current policy baseline. Per capita payroll taxes would increase by 1.3 and 0.2 percent relative to the current policy baseline, in 2031 and 2050 respectively.

Government spending redirects real resources in the economy and can crowd out private capital formation. An additional $1 trillion debt this year could decrease GDP by as much as 0.28 percent in 2050.
Public infrastructure investment boosts the productivity of private capital and labor, leading to higher output, but this positive effect can be offset if the investment is financed with additional government borrowing. PWBM estimates that an illustrative 10-year, $2 trillion public investment plan will raise public capital by 4.6 percent but lower private capital by 0.8 percent in 2040, with a net zero effect on GDP in 2040.

We estimate that Sen. Capito’s $330 billion infrastructure package, funded by user fees over 8 years, would increase GDP by about 0.05 percent in 2050. A $579 billion infrastructure investment being considered by a bipartisan group of senators, would increase output in 2050 by 0.1 percent if funded by user fees or have roughly zero net effect on GDP if deficit financed.

PWBM estimates that the learning loss from school closures reduced GDP by 3.6 percent in 2050. Extending the 2021-22 school year by one month would cost about $75 billion nationally but would limit the reduction in GDP to 3.1 percent. This smaller reduction in GDP produces a net present value gain of $1.2 trillion over the next three decades, equal to about a $16 return for each $1 invested in extending the 2021-22 school year.

PWBM projects that the American Families Plan (AFP) would spend $2.3 trillion, about $500 billion more than the White House’s estimate, over the 10-year budget window, 2022-2031. We estimate that AFP would raise 1.3 trillion in new tax revenue over the same period. By 2050, the AFP would increase government debt by about 4 percent and decrease GDP by 0.3 percent.

PWBM estimates that raising the top statutory rate on capital gains to 39.6 percent would decrease revenue by $33 billion over fiscal years 2022-2031. If stepped-up basis were eliminated—as proposed in President Biden’s campaign plan—then raising the top rate to 39.6 percent would instead raise $113 billion over 2022-2031.

While corporations are at historically high levels of debt relative to assets, leverage remains close to its historical average relative to firms’ market value and relative to interest expense as a fraction of cashflow. In PWBM’s dynamic firm model, reducing the deductibility of interest expenses by 10 percentage points decreases corporate output by 0.26 percent while decreasing corporate debt by 6.76 percent.

PWBM projects that the American Jobs Plan proposed by President Biden would spend $2.7 trillion and raise $2.1 trillion dollars over the 10-year budget window 2022-2031. The proposal’s business tax provisions continue past the budget window, decreasing government debt by 6.4 percent and decreasing GDP by 0.8 percent in 2050, relative to current law.

PWBM projects that by 2050, the legalization provisions of the U.S. Citizenship Act proposed by President Biden would increase the size of the U.S. population by 4.21 percent, increase GDP by 0.5 percent, but decrease GDP per capita by 0.2 percent. More specific legalization proposals targeted at farm workers, DACA recipients, and essential workers would each increase GDP per capita by 0.1 percent in 2050.

PWBM projects that vaccinating all those eligible by reducing vaccine hesitancy would prevent up to 8.3 million cases in 2021, increase employment by 2.6 million in December 2021, and boost Q4 2020 to Q4 2021 GDP growth by 2 percentage points. In fact, failure to reduce vaccine hesitancy could lead to a “perfect storm” if people also become optimistic and increase their social contact rates beyond the baseline rates that we previously projected. Indeed, increasing social contact rates to 85 percent of pre-COVID levels by the end of 2021 would lead to up to 4.6 million additional COVID-19 cases in 2021.

PWBM projects that the Ultra-Millionaire Tax Act of 2021, introduced by Senator Elizabeth Warren, would raise $2.1 trillion over the standard 10-year budget window (2022-2031) under scoring conventions used by government agencies. Incorporating the effects of enhanced IRS enforcement, our projection rises to $2.4 trillion over 2022-2031 and $2.7 trillion over 2023-2032. Also incorporating macroeconomic effects of the Act reduces estimated revenue to $2.0 trillion over 2022-2031 and $2.3 trillion over 2023-2032. We estimate that the Act would reduce GDP by 1.2 percent in 2050.

PWBM estimates that schools in the Philadelphia and surrounding suburb districts with more Black students are less likely to reopen with in-person instruction relative to schools with more White students, even after controlling for differences in income by district. By March 2021, Black students in grades K-5 have incurred a 11.9 percent loss in lifetime income from school closures while White students have lost 10.4 percent. Students educated in the city face larger losses than students educated in the surrounding suburbs.

This post compares effective marginal tax rates (EMTRs) under the Family Security Act proposed by Sen. Romney and the Child Tax Credit (CTC) expansion proposed by Rep. Neal and President Biden. Married families with children and less than $45,000 in income would face EMTRs 4.4 percentage points higher under the Romney proposal and 6 percentage points higher under the Biden/Neal proposal.

This brief analyzes the epidemiological and economic effects of maintaining, increasing, or decreasing the current pace of daily COVID-19 vaccinations. PWBM projects that doubling the number of vaccine doses administered daily would boost employment by more than 2 million and real GDP by about 1 percent over the summer of 2021, with smaller effects later in the year.

This brief analyzes the impact on health insurance premiums, out-of-pocket spending, and the economy for the healthcare proposal from Daniel Evan McGary as part of the PWBM Democratizing the Budget Contest.

PWBM projects that the broad distribution of relief payments in the Biden administration’s proposed plan will flow largely into household savings and will produce only small stimulative effects, with 73 percent of the stimulus going directly into household savings. Sectors affected by the pandemic still face restrictions and are unlikely to grow from stimulus payments, while much of the rest of the economy is operating close to productive capacity.

PWBM estimates that three provisions in the Biden COVID relief plan—direct payments, expanding the Child Tax Credit, and expanding the Earned Income Tax Credit—together would cost $595 billion in calendar year 2021, with 99 percent of households in the bottom 80 percent of incomes receiving a benefit.

PWBM estimates that the $1.9 trillion in spending in the full Biden relief plan would increase GDP in 2021 by 0.6 percent. Over time, the additional public debt resulting from the Biden plan would decrease GDP by 0.2 percent in 2022 and 0.3 percent in 2040.

As part of PWBM’s “Democratizing the Budget Contest,” Andrew Biggs, Ph.D. proposed a package of Social Security reforms centered around gradually transitioning the program to a flat benefit for new retirees. PWBM projects that this proposal would reduce the program’s conventional 75-year imbalance by 2.44 percent of taxable payroll, leaving a remaining imbalance of 0.8 percent of current law taxable payroll. The proposal would decrease GDP by 0.6 percent in 2030 while increasing GDP by 0.6 percent in 2050.

The TEACHUP program, proposed by Rick Miller, Ph.D. as part of the PWBM Democratizing the Budget Contest, would give grants to states in order to provide full-day preschool for four-year-old children at or below 200 percent of the poverty line. On a conventional basis, PWBM projects that TEACHUP would cost $92.4 billion over ten years and a total of $282.53 billion by 2050. However, on a dynamic basis that includes productivity effects and expansion of the tax base, PWBM estimates that the program would effectively pay for itself by 2050 by holding public debt nearly constant.

We estimate the average cost of a COVID-19 infection for four Philadelphia-area counties at $8,000 to $13,000, less than half of our national average cost estimate ($27,230). We estimate a trade-off between cost of infections to the community from in-person schooling versus the lost future earnings to students from closing schools. For example, if Montgomery county had implemented full in-person school in the fall, we project the costs of infection would have been at most $429 million. However, closing schools costs students as much as $4.4 billion in present value of future wages.

As of mid-November, there have been 700,000 more business applications in 2020 than at the same point in 2019, especially concentrated in pandemic-affected industries such as online retail. Accounting for this change in industry composition, we project that the 600,000 additional applications in the first three quarters of 2020 will result in 27,000 more employer businesses formed by Q3 2021 and about 120,000 additional jobs.

This post is part of a series that explains tax concepts. The highest 1 percent of earners are responsible for 71 percent of capital gains realizations. President Trump has proposed lowering the top rate on income from capital gains and dividends, while former Vice President Joe Biden has proposed increasing the top rate for taxpayers with more than $1 million in income.

We estimate that each month of school closures in response to the COVID pandemic cost current students between $12,000 and $15,000 in future earnings due to lower educational quality. We also estimate total value-of-life, medical, and productivity costs per infection at $38,315 for September 2020. Using these costs, we calculate the cost-benefit threshold to keeping schools closed for October at over 0.355 new expected infections in the community per student kept out of school.

The Biden healthcare plan focuses on expanding access and affordability of insurance and decreasing prescription drug prices. We estimate that by 2030, relative to current law, the Biden plan would decrease the uninsurance rate from 10 percent to 6 percent, decrease private insurance premiums by 23 percent and out-of-pocket spending by 16 percent, and decrease the percent of the population that forgoes medical care from 7 percent to 4 percent. The Biden healthcare plan would increase net spending by $352 billion over ten years but would reduce debt by 4.5 percent over that period due to dynamic growth effects.

PWBM estimates that reducing the top preferential rates on capital gains and dividends from 20 percent to 15 percent will cost $98.6 billion dollars over the ten year budget window. This tax cut will only benefit tax units in the top 5 percent of the income distribution, with 75 percent of the benefit accruing to those in the top 0.1 percent of the income distribution.

PWBM uses dynamic distributional analysis to evaluate the effects of the Biden platform on different age and income groups. We find that working-age individuals in the bottom 40 percent of taxable income benefit the most due to expanded health insurance, increases in housing subsidies, and lower cost of prescriptions in the Biden platform, while young, high-income individuals and wealthy retirees see net losses due to tax increases and lower returns on their savings.

Using PWBM’s dynamic model, we show the macroeconomic effects of Presidential candidate Biden’s immigration proposal. By 2050, GDP increases by 1.7 percent in 2050 relative to current law while GDP per capita stays the same.

Presidential candidate Joe Biden recently announced a proposal to temporarily expand the Child Tax Credit (CTC). We find that this proposal would cost $110 billion if implemented solely for calendar year 2021 and would cost $1.4 trillion over ten years if extended permanently. While higher income households are more likely to have qualifying children and would see larger average tax cuts ($1160 for the 90-95th percentile), lower income groups would see the largest relative benefit, with after-tax incomes increasing by 9 percent for the bottom quintile.
Using more recent data on international capital flows, we find that the “effective openness” of the U.S. economy has decreased to 31.5 percent openness for private capital flows and 33.3 percent U.S. debt take-up by foreigners. This decline is in line with our prediction from last year’s posts on the effect of tariffs.

Additional education is associated with similar reductions in mortality rates for men and women—in 2016, for example, men and women with high school degrees had mortality rates 16 percent and 14 percent lower, respectively, than those without degrees. That same year, however, the mortality advantage of completing a high school degree was 18 percentage points higher for White people than for Black people.

Over the last two decades, a mortality gap has opened up across education levels. For those born after 1950, each additional level of educational attainment is associated with at least an 18 percent lower mortality rate.

We use PWBM’s new dynamic model enhancement of the business sector to analyze several foreign and domestic business taxation provisions from the Biden tax plan. While raising the effective tax rate on foreign profits increases domestic capital, wages, and GDP, provisions that raise domestic business taxes have the opposite effect—when combined, these business tax provisions decrease the capital stock by 0.21 percent and decrease wages by 0.69 percent in 2050.
We estimate that the anticipated Trump administration bill to invest $1 trillion in infrastructure would increase GDP up to $720 billion through June 2022.

We estimate that the effect of physical encounters on coronavirus transmission has fallen over time, suggesting that people have adapted their behavior in accordance with social distancing best practices. Whether reopenings cause additional outbreaks will depend on the continuation of these behavior changes.

PWBM estimates that the CARES Act increases GDP by about 5 percent in 2020 while lowering GDP by 0.2 percent in 2030.

We report results from a survey of Pennsylvania physicians, finding that more than half report large decreases in hours worked for staff in their workplaces and 44 percent anticipate their income to decrease by more than half. We estimate PA doctors could lose $6 billion in income during 2020 Q3, with 45 percent of those in private practice anticipating shutting down within the next six months.

We estimate that a large infrastructure bill would increase GDP by no more than $360 billion per year for 2020 and 2021. Short-run GDP expansion from new infrastructure spending is limited by available projects and likely social distancing measures, and so states could not absorb more than $300 billion per year in new federal aid over the next two years.

In an attempt to prevent and reverse layoffs due to coronavirus, the recently-passed CARES Act established a new lending program targeted at businesses with 500 or fewer employees. These businesses account for 99.7 percent of all firms, 47.3 percent of employment, 40.7 percent of annual payroll, and about one-third of the growth in employment and wages. These businesses also account for 60 percent of employment in the leisure and hospitality sector, which has been disproportionately harmed by the pandemic’s effects.

We estimate the lasting macroeconomic effects of the anticipated recession due to coronavirus, as the initial shock leads to lower federal revenue and higher debt. If the economy recovers the year after a deep recession ("V shape"), we project that federal debt will be 3.2 percent higher and GDP will be 0.3 percent lower by 2030. If the recovery occurs over two additional years (“U shape”), federal debt rises by 5.9 percent and GDP falls by 0.6 percent lower by 2030. Barring future fiscal policy to reduce debt, so-called “potential GDP” will, therefore, be permanently lower due to the coronavirus.

The CARES Act establishes a new, temporary charitable deduction (limited to $300) in tax year 2020 for taxpayers who claim the standard deduction. PWBM projects that this provision would cost about $2 billion and would have little effect on total donations. More than half (53 percent) of the benefit would accrue to families in the 60th to 90th percentiles of the income distribution.

If oil prices remain at current levels through the end of 2020, we estimate that growth in business investment will be 1.9 percentage points lower and growth in GDP will be 0.25 percentage points lower in 2020.

We present budgetary and distributional estimates for three potential versions of the lump-sum payment that President Trump announced earlier today. All three options increase the after-tax income of low income households the most. However, higher-income households have more children on average and would receive larger cash payments unless additional adjustments are made.

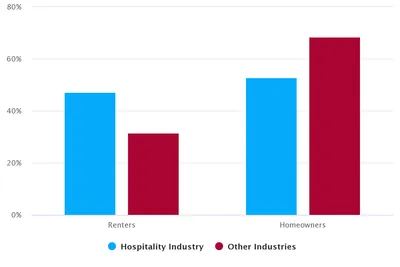
The economic downturn due to coronavirus has disproportionately harmed workers in the leisure and hospitality businesses, such as restaurants and bars—these workers tend to be less-educated and lower-income.

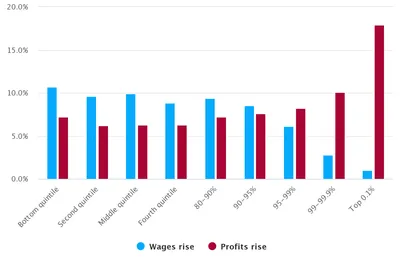
We expand our previous analysis of President Trump’s proposed payroll tax holiday by considering two scenarios for how the employer side of the tax cut would be distributed: either to the full benefit of business owners and corporate equity holders (“profits rise”) or to the full benefit of workers (“wages rise”). When profits rise, the top 1 percent of families by income receive about 29 percent of the total payroll tax cut, compared to about 4 percent of the total cut when wages rise.
Recent revisions to estimates of corporate profits may explain the unanswered question of why corporate income tax receipts have underperformed CBO estimates in recent years.

We estimate the budgetary, economic and distributional effects of raising the Social Security taxable maximum to $300,000 starting on January 1st, 2021. We project that it would raise $1.2 trillion of additional revenue on a conventional basis over the 10-year budget window and lower GDP 1.7 percent by 2050. Families in the top 10 percent of the income distribution would bear 93 percent of the overall burden of this tax increase.

We estimate the budgetary, economic and distributional effects of eliminating all Schedule-A itemized deductions starting on January 1st, 2021. We project that it would raise about $2.1 trillion of additional revenue on a conventional basis over the 10-year budget window and increase GDP by 2.3 percent by 2050. Families in the top 10 percent of the income distribution would bear 75 percent of the overall burden of this tax increase.

Under current law, PWBM estimates that a 33% capital gains tax rate maximizes revenue, but this rate increases to 42% if stepped-up cost basis at death were eliminated.

We estimate the budgetary and economic effects of increasing the top rate on long-term capital gains and qualified dividends from 20 percent to 24.2 percent, which is enacted on January 1st, 2021. We project that it will raise around $60 billion of additional revenue on a conventional basis over the 10-year budget window and increase GDP by 0.1 percent by 2050.

We estimate the budgetary and economic effects of a new broad-based 1 percent value-added tax (VAT) with a progressive universal rebate calculated based on earnings, which is enacted on January 1st, 2021. We project that it will raise $700 billion of additional revenue on a conventional basis over the 10-year budget window and increase GDP by 0.8 percent by 2050.

We estimate the budgetary and economic effects of a new carbon tax of $30 per ton of emissions, which is enacted on January 1st, 2021, rising by inflation plus 5 percent through 2050. We project that it raises $1.6 trillion of additional revenue on a conventional basis over the 10-year budget window and increases GDP by 2.2 percent by 2050.

Study finds that patient satisfaction scores are related to factors other than health. Linking these scores to physician pay could lead to lower compensation for young female doctors and incentivize doctors to prescribe controlled substances at higher rates.

PWBM’s Jon Huntley and Richard Prisinzano discussed how the financing of a federal infrastructure plan influences its effect on economic growth. Even though infrastructure investments increase productivity, plans that are deficit-financed can reduce GDP relative to current policy.

We estimate that a one-year “payroll tax holiday” would cost the federal government between $141 and $151 billion over the standard budget window and increase GDP by 0.3 percent in 2020, with effects eventually turning slightly negative over time with higher deficits.

PWBM introduces a new measure of distribution that corrects numerous deficiencies in existing distributional measures that are commonly used to evaluate policy analysis.

Using PWBM’s new dynamic distributional analysis, we find that the Social Security 2100 Act benefits wealthy, retired households at the expense of young, high-income households.

PWBM’s Efraim Berkovich, the Wharton School’s Marshall Meyer and Mary Lovely of the Maxwell School of Syracuse University discussed how the recently imposed tariffs on Chinese goods are raising prices for consumers, disrupting supply chains and weighing down economic growth in the long-run.

We find that, excluding times of intervention by the Federal Reserve, interest rates on U.S. government debt are higher when levels of effective openness to foreign capital flows are lower, increasing the government’s borrowing costs.

We project that, although a trade war initially lowers the share of U.S. capital owned by foreigners, the trade war will actually increase the amount of American business capital owned by foreigners, by almost $1 trillion by 2028. Over time, the foreign owned share of business capital rises from about 29 percent today to over 34 percent in 2049.

We project that even if the recently imposed tariffs are removed, GDP will be permanently smaller relative to having had no trade war. Extending the current trade war by several more years will lead to smaller losses in GDP in 2020 but will reduce GDP by more in the long run.

On June 7, Hill staffers, fiscal experts, and PWBM gathered to discuss the federal revenue loss created by tax avoidance. The U.S. has different tax rates for different income streams, thus there are opportunities for individuals and businesses to reduce their tax bills by recharacterizing income to pay a lower rate.

In today’s low interest rate environment, the cost of federal debt is lower than it used to be. However, long-run concerns loom. PWBM projections show that policies that reduce federal debt over time produce more economic growth than current policy.

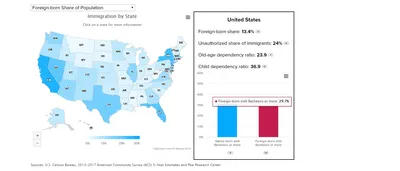
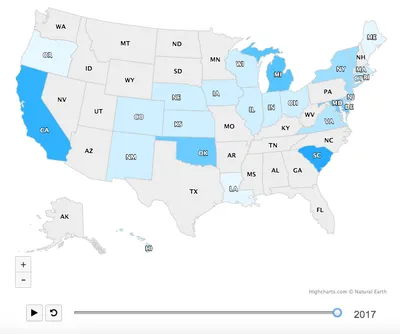
Introducing PWBM’s Interactive 2020 Campaign Issue State Maps. We use data to inform people about the impact of campaign proposals on their states. Here we present six indicators focused on immigration policy for each state. Although PWBM has shown that increasing immigration boosts economic growth for the U.S. as a whole, these indicators imply that the impact of changes to immigration policy on a state will depend on the demographics of that state.

We project that increasing annual net legal immigration leads to a younger and more educated U.S. population. These population changes are likely to have a positive impact on entitlement finances and tax burdens relative to current policy. In contrast, decreasing annual net legal immigration likely has the opposite effects.

PWBM projects that by 2050 one in ten U.S. citizens will be foreign-born, up from 7 percent today. We account for different historical naturalization patterns of immigrants from different countries, including the time immigrants reside in the U.S. Thus, this increase reflects shifts in the origins of lawful immigrants. In particular, we project that the shift away from immigrants arriving from Mexico and toward immigrants arriving from Asia to continue.

PWBM projects the number of unauthorized immigrants to fall from a peak of 4 percent of the U.S. population in 2007 to under 2.5 percent in 2050. In recent years, fewer unauthorized immigrants have arrived from Mexico while more have arrived from Central America. PWBM projects that future growth of the population of unauthorized immigrants will be driven by visa overstays.

By substantially expanding the standard deduction, the Tax Cuts and Jobs Act reduced the incentive to make charitable contributions. We make use of data on non-tax itemizers to examine several potential policies designed to increase tax incentives for charitable giving. In particular, we project that a non-refundable credit for charitable contributions for filers who don’t itemize would expand giving by $208 billion (5.2 percent) and reduce tax revenue by $267 billion (0.6 percent) over the 10 year budget window. Other reforms produce smaller increases in giving along with smaller losses in revenue.